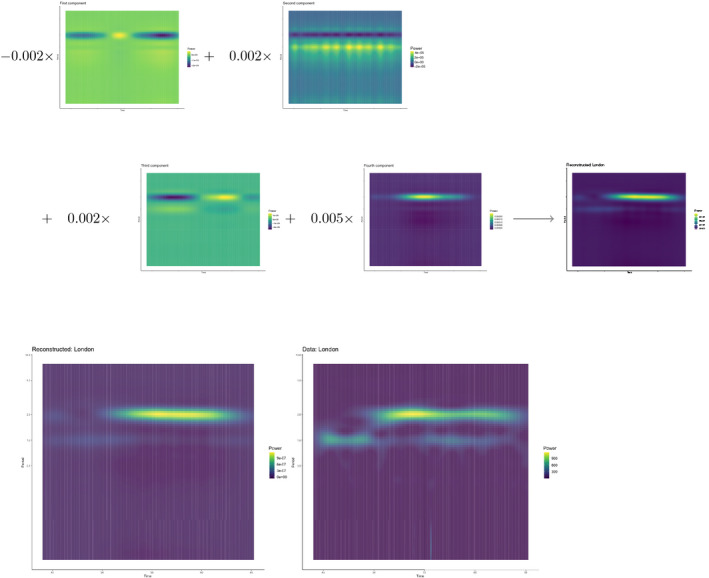
Figure 7.

A component by component illustration of the reconstruction of the London wavelet spectra. Each time‐frequency component is multiplied by the location‐specific scalar. These scalars can amplify signals or switch their signs and determine the influence of each component on the final reconstruction. The bottom row compares the original with the reconstructed spectra
