FIGURE 4.

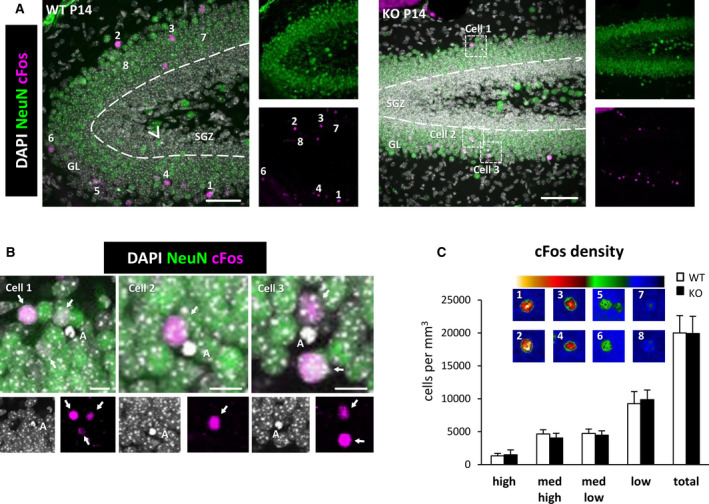
cFos+ cells in the dentate gyrus (DG) of wild‐type (WT) and Cstb knockout (KO) postnatal day 14 (P14) mice. A, Representative confocal images of the DG of WT and Cstb KO mice. Healthy or apoptotic (pyknotic/karyorrhectic) nuclear morphology was visualized with 4,6‐diamidino‐2‐phenylindole (DAPI; white), neurons were identified with the neuronal marker NeuN (green), and activated neurons were stained for the early expression gene cFos (magenta). Arrowhead points to an apoptotic cell in the subgranular zone (SGZ) in WT mice; framed apoptotic cells in Cstb KO mice are shown in B. Numbered cFos+ cells are shown in C, as cells with high (1, 2), medium‐high (3, 4), medium‐low (5, 6), and low (7,8) cFos intensity. GL, granular layer. (B) High‐magnification examples showing the close proximity between apoptotic cells (DAPI, white) and cFos+ neurons (magenta) in Cstb KO mice. Granular neurons are stained with NeuN (green). Arrows point to cFos+ neurons. C, Distribution of cFos+ cells in WT and Cstb KO mice (per mm3). The color code indicates the classification criteria of the cFos+ cells based on their intensity (high, medium‐high, medium‐low, low). A total of 1046 cells for WT P14 mice and 713 cells for Cstb KO mice were quantified and classified according to their cFos expression. No significant differences were found. Scale bars = 50 μm (A), 10 μm (B); z‐thickness = 28 µm (A, WT), 17.5 µm (A, KO)
