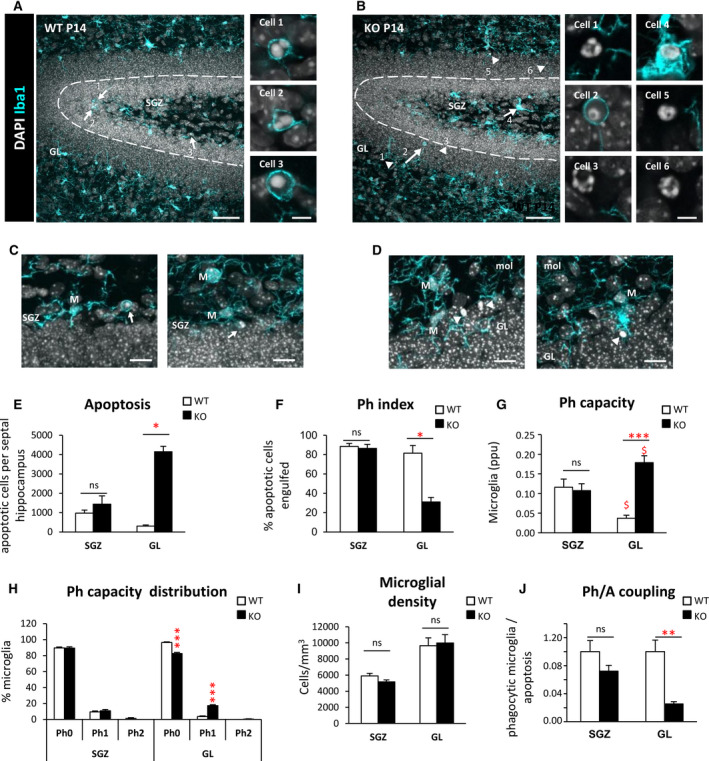
FIGURE 5.

Phagocytosis impairment is specific to the granule cell layer in Cstb knockout (KO) mice at postnatal day 14 (P14). A, B, Dentate gyrus (DG) general view of both wild‐type (WT) and Cstb KO P14 mice. Nuclei are stained with 4,6‐diamidino‐2‐phenylindole (DAPI; white) and microglia with Iba1 (cyan). Closeup images show phagocytosed and nonphagocytosed apoptotic cells in WT and Cstb KO P14 mice. GL, granular layer; SGZ, subgranular zone. C, D, Representative images of apoptotic cells (condensed DAPI) engulfed by microglia (M; cyan) in the SGZ of WT P14 mice (C) and nonphagocytosed cells in the GL of Cstb KO P14 mice (D). Arrows point to phagocytosed apoptotic cells and arrowheads to nonphagocytosed apoptotic cells (A‐D). E, Number of apoptotic cells (pyknotic/karyorrhectic) both in the SGZ and GL, per septal hippocampus (n = 12 animal for each condition). F, Phagocytic index (Ph index; in % of apoptotic cells being engulfed by microglia) in the SGZ and GL of the septal hippocampus in WT and Cstb KO P14 mice. G, Histogram showing the phagocytic capacity (Ph capacity) distribution of DG microglia (in % of microglial cells) in the SGZ and GL. H, Weighted Ph capacity of DG microglia (in parts per unit). I, Microglial density (cells/mm3) per septal hippocampus in both WT and Cstb KO P14 mice, distinguishing between SGZ and GL. J, Phagocytosis/apoptosis (Ph/A; in fold change) in the SGZ and GL of the septal hippocampus in WT and Cstb KO P14 mice. Bars represent the mean ± standard error of the mean. *P < .05, **P < .01, ***P < .001 by Student t test comparing WT versus KO. ns, not significant. Scale bars = 50 μm (A, B), 5 μm (inserts in A, B), 30 μm (C, D); z‐thickness = 18.9 µm (A, B), 9.8 µm (C left), 16.1 (C right), 11.2 µm (D left), 12.6 µm (D right). $ means P < .005 comparing GL vs SGL
