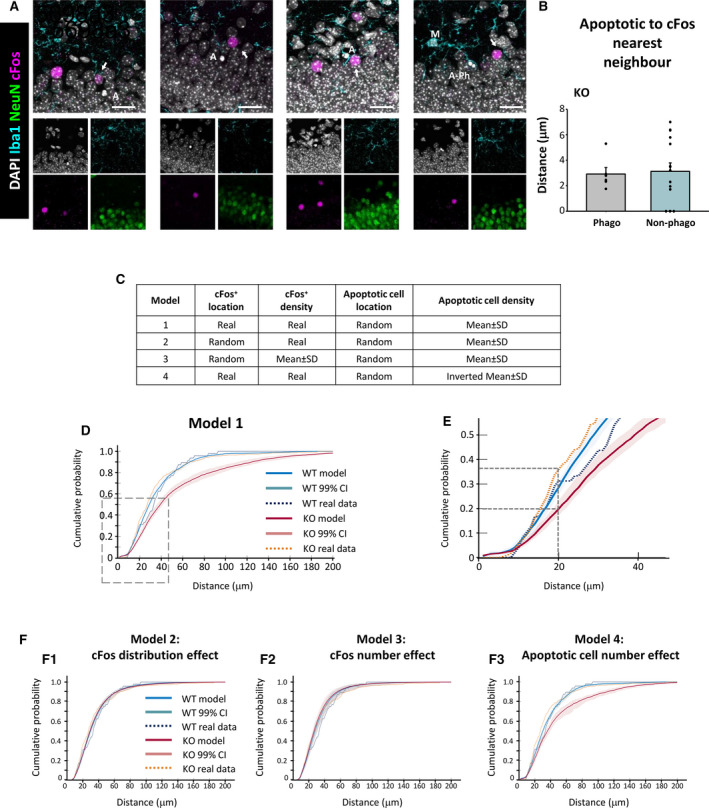
FIGURE 6.

Proximal relationship between apoptotic cells and cFos+ neurons in the granule cell layer of Cstb knockout (KO) mice. A, Representative confocal images of the granular layer of Cstb KO mice. Healthy or apoptotic (pyknotic/karyorrhectic) nuclear morphology was visualized with 4,6‐diamidino‐2‐phenylindole (DAPI; white), neurons were identified with the neuronal marker NeuN (green), microglia (M) were identified with Iba1 (cyan), and activated neurons were stained for the early expression gene cFos (magenta). Both phagocytosed (A‐Ph) and nonphagocytosed apoptotic cells (A) were close to cFos+ neurons (arrows). B, Quantification of distance from phagocytosed (Phago) and nonphagocytosed (Non‐phago) apoptotic cells to the cFos+ nearest neighbor (NN), for those cells that met the inclusion criteria (see Materials and Methods). C, Summary of the different simulation models based on the location and density of cFos+ and apoptotic cells. D, Cumulative probability of the distances between apoptotic cells and NN cFos+ neurons for wild‐type (WT; blue) and Cstb KO mice (red), resulting from 10 000 simulations of a virtual three‐dimensional (3D) model, indicating the 99% confidence interval (CI). The cumulative probability for real (measured) data is shown for WT (dotted blue) and Cstb KO (dotted orange). E, Amplification of the area shown in D. F, Cumulative probabilities of the distances between apoptotic cells and NN cFos+ neurons for WT (blue) and Cstb KO mice (red), resulting from 10 000 simulations of the indicated virtual 3D model. Scale bars indicate 20 μm. z‐thickness = 9.1 µm, 7.7 µm, 16.8 µm, 9.1 µm (A, from left to right)
