
Fig 5.
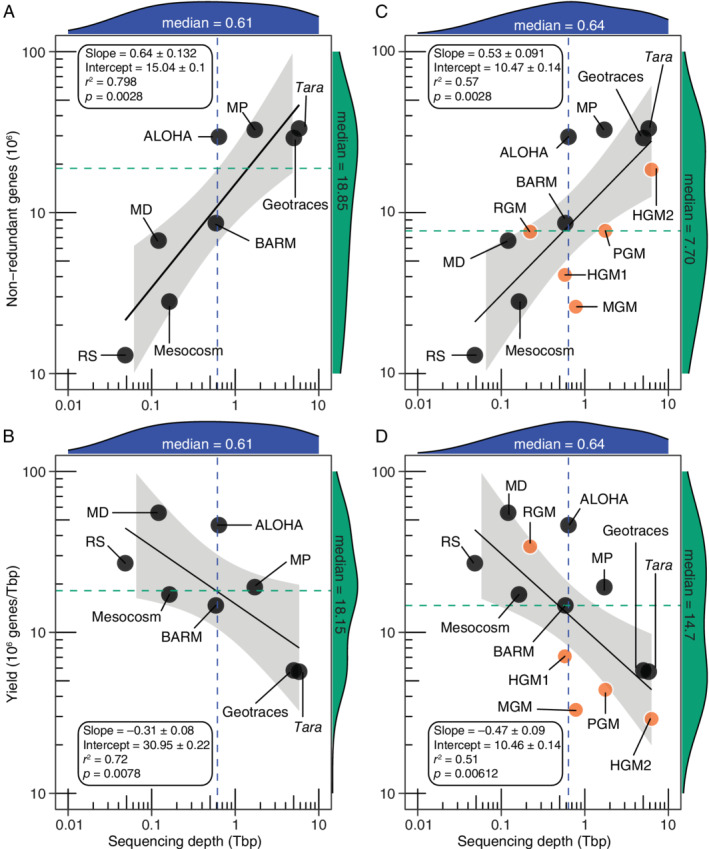
The relationship between sequencing depth and the number of non‐redundant genes or gene yield in different high‐throughput sequencing projects encompassing only marine metagenomes (A and B) or including host‐associated microbiomes (B and C). The black line indicates the log–log fit to the data (Supplementary Data 11), while the grey area shows the 95% confidence intervals for the regression curve. The distributions of the ‘x’ and ‘y’ axis values are highlighted in blue and green respectively, with corresponding medians denoted by coloured dotted lines. Black and orange circular symbols denote marine and mammalian enteric microbiomes respectively. Abbreviations: RS, Red Sea Cruise 2011; MD, Malaspina Deep; BARM, Baltic Sea reference metagenomes; MP, Malaspina Profile; HGM, human gut microbiome; PGM, pig gut microbiome; MGM, mouse gut microbiome; RGM, rat gut microbiome. Note that GOS (Table 1) was not included as it used a different sequencing technology. Additional information is provided in Supplementary Data 1–11. [Color figure can be viewed at wileyonlinelibrary.com]