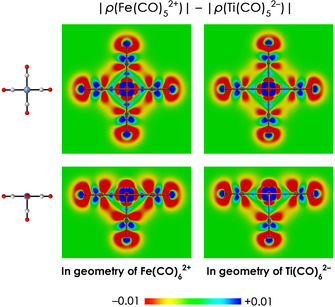
Figure 6.

Difference in electronic density distribution between Fe(CO)5 2+ and Ti(CO)5 2−, obtained by subtracting the absolute density of Ti(CO)5 2− from the absolute density of Fe(CO)5 2+ while both systems share the same geometry (i.e. the geometry of Fe(CO)6 2+ (left) and Ti(CO)6 2− (right)). Hence, positive values (blue color) correspond to regions where Fe(CO)5 2+ has more electronic density, while negative values (red color) correspond to regions where Ti(CO)5 2− has more electronic density. Top: viewed from the missing CO (frag‐CO) side. Bottom: viewed from CO in M(CO)5. Data obtained at the ZORA‐BLYP/TZ2P level of theory.
