
Figure 8.
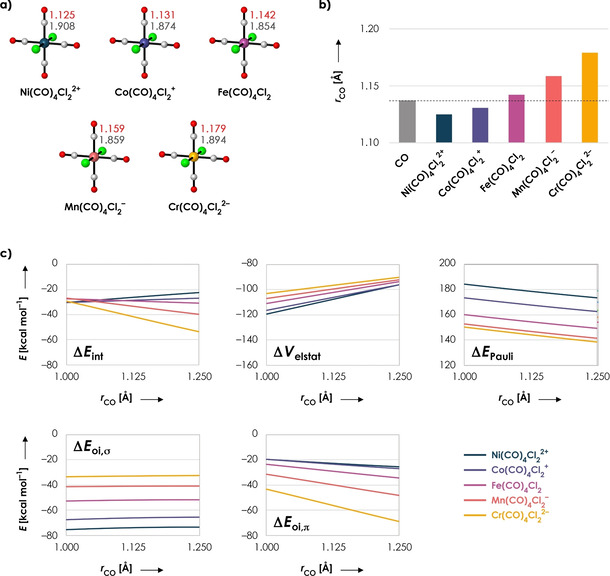
a) Molecular systems with C−O (red) and M−C (gray) distances [in Å]. b) C−O distances [in Å]. The dashed line represents the C−O distance of isolated CO. c) Energy decomposition terms (in kcal mol−1) as a function of the C−O distance r (in Å) for Ni(CO)4Cl2 2+ (dark blue), Co(CO)4Cl2 + (purple), Fe(CO)4Cl2 (pink), Mn(CO)4Cl2 − (orange) and Cr(CO)4Cl2 2− (yellow). One C−O distance (frag‐CO) has been varied in a stepwise manner from 1.00 to 1.25 Å while keeping its corresponding M−C distance fixed at 1.85 Å; the rest of the system (frag‐M(CO)3Cl2) is frozen in the same geometry as the fully optimized overall system. All data obtained at the ZORA‐BLYP/TZ2P level of theory.