

Abstract
A significant amount of attention has been given to the design and synthesis of co‐crystals by both industry and academia because of its potential to change a molecule's physicochemical properties. Yet, difficulties arise when searching for adequate combinations of molecules (or coformers) to form co‐crystals, hampering the efficient exploration of the target's solid‐state landscape. This paper reports on the application of a data‐driven co‐crystal prediction method based on two types of artificial neural network models and co‐crystal data present in the Cambridge Structural Database. The models accept pairs of coformers and predict whether a co‐crystal is likely to form. By combining the output of multiple models of both types, our approach shows to have excellent performance on the proposed co‐crystal training and validation sets, and has an estimated accuracy of 80 % for molecules for which previous co‐crystallization data is unavailable.
Keywords: artificial neural networks, co-crystals, crystal engineering, machine learning, solid-state structures
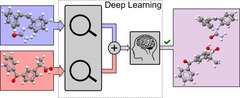
An artificial neural network calculates whether two molecules are likely to form a co‐crystal. The approach shows excellent performance on the proposed co‐crystal training and validation sets, and has an estimated accuracy of 80 % for molecules for which previous co‐crystallization data is unavailable. The figure illustrates the prediction of the newly discovered drug–drug co‐crystal containing ketoprofen and carbamazepine.
Introduction
Molecular solids [1] appear in many different ways, and the solid‐state landscape of a molecule may cover various crystalline forms, ranging from polymorphs and hydrates to more complex multicomponent crystals.[ 2 , 3 ] In the latter, the formation of new intermolecular interactions between the target and an auxiliary compound has proven to be an excellent tool to modify physico‐chemical characteristics of a target compound, such as the (aqueous) solubility, bio‐availability, density, and melting point.[ 4 , 5 , 6 , 7 , 8 , 9 ] Multicomponent crystals therefore find their application in various fields (e.g. fertilizers,[ 10 , 11 ] pigments[ 12 , 13 ] and medicine[ 14 , 15 , 16 ]), and play a pivotal role in the effective formulation of pharmaceuticals.
The design of multicomponent crystals is non‐trivial and new forms are often identified via trial and error. Unlike salts, where proton transfer leads to strong ionic/coulombic interactions, solvates and co‐crystals are assembled through weaker, non‐covalent interactions (e.g. hydrogen bonding, π‐π interactions,…). Such intermolecular interactions between functional groups are often used to rationalize the possibility of aggregation, [17] but with no guarantee that the postulated interactions will emerge.
Whereas polymorphs, salts and solvates are commonly screened using automated high throughput systems,[ 8 , 18 , 19 , 20 ] the experimental screening of co‐crystals remains labour‐intensive and time‐consuming. In order to shorten this process, a variety of computational tools, based on hydrogen‐bond propensities,[ 21 , 22 , 23 , 24 ] statistical analysis and modeling of molecular descriptors,[ 25 , 26 , 27 ] electrostatic potential maps,[ 28 , 29 , 30 , 31 , 32 ] crystal structure prediction,[ 33 , 34 , 35 , 36 ] COSMO‐RS,[ 37 , 38 ] molecular dynamics, [39] or PIXEL calculations[ 40 , 41 ] and Hirshfeld surface analysis [42] (as for instance implemented in the CrystalExplorer software package [43] ), have been developed to aid in the discovery of adequate combinations of the constituents or coformers. Although these computer‐aided methods have succeeded in enhancing co‐crystal screening protocols, some of the shortcomings include their bias towards small or structurally related datasets, oversimplified assumptions regarding the mechanisms of interaction, and, in some cases, their computational costs.
Recently, we introduced a holistic approach to study co‐crystallization using network science and link prediction.[ 44 , 45 ] Analysis of a network of coformers extracted from the Cambridge Structural database (CSD) [46] shows that, rather than being a random assembly of coformers, it represents a rational source of co‐crystal information that can form a basis for prediction. Therefore, it would be very appealing to develop a method that utilizes all this co‐crystal information, and is able to predict co‐crystals for coformers lacking any experimental data on co‐crystal formation. Such a tool would for instance enable the evaluation of the co‐crystal formation propensity for in silico determined drug candidates (prior to their actual synthesis), or aid in the (co‐)crystallization of molecules that are amorphous in their pure form.
Artificial neural networks, and in particular deep learning, [47] have emerged as promising tools for data‐driven prediction. Given an adequate molecular representation, artificial neural networks can be used to, for example, predict physico‐chemical properties (e.g. solubility) or classify molecules, hereby assigning the input to a certain class (e.g. toxic or non‐toxic).
Driven by the recent advances in artificial neural networks and the promising source of co‐crystal information present in the CSD, we introduce a new approach to predict co‐crystal formation using neural networks. Two neural network model types are introduced that each accept a pair of coformers as input and classify the combination as a possible co‐crystal or not. By optimizing the configuration of each model type, we obtain several equally performing models, which are stored in model ensembles to make a combined prediction. [48] We will demonstrate the excellent performance of the model ensembles by repredicting all available binary co‐crystal data in the CSD via cross‐validation. In a case study involving carbamazepine, we further validate the approach by analyzing the predictions for known and experimentally tested combinations. [38] Finally, we compiled predictions for ketoprofen, a compound unknown to form co‐crystals, and present its first drug‐drug co‐crystal with carbamazepine.
Results and Discussion
Overview of Model Design and Selection
Two neural network model types are proposed to classify pairs of coformers as possible co‐crystals (Figures 1 a,b), differing in their required molecular representation as input and the initial pre‐processing step (blue modules in Figure 1). A wide variety of molecular representations exist, and in an effort to encode both the functionalities and size/shape of the coformers, we opted for circular (or extended‐connectivity) fingerprint vectors [49] and molecular graphs [50] as input formats (Figure 2). Although playing an important role in co‐crystal formation and synthesis, the stoichiometry of each individual co‐crystal was not incorporated as a model parameter, as this was not found to influence the predictive performance. The stoichiometry of a predicted coformer pair is therefore not determined by the models, but should rather be explored experimentally.
Figure 1.
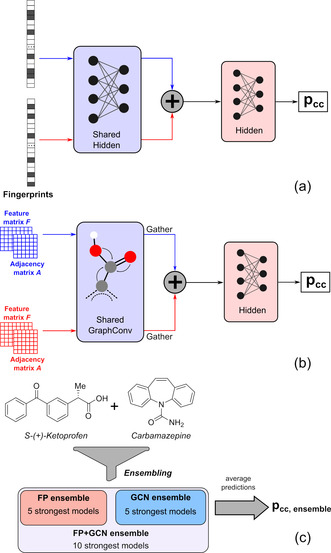
Model types and ensembles for the prediction of co‐crystal formation. (a) FP: Fingerprint‐based model type. (b) GCN: Graph convolution‐based model type. (c) Model ensembles return the average of the predictions of their constituents.
Figure 2.
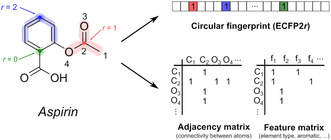
Featurization of aspirin (acetylsalicylic acid) as a circular fingerprint vector and molecular graph. (top right) Circular or extended‐connectivity fingerprints (ECFP2r, where r is the radius) store substructures around each atom up to a certain radius r in a binary vector. The presence or absence of these substructures are encoded as 1 or 0, respectively. (bottom right) Molecular graphs store the connectivities between the molecule's atoms in an N atoms×N atoms adjacency matrix, and their features (such as atom type, hybridization etc.; Table S1) in an N atoms×N features feature matrix. Explicit zeros are omitted for clarity.
Conceptually, both model types pre‐process each coformer in an equivalent manner before combining them together to make the final prediction. Whereas the initial pre‐processing step of the molecular fingerprint‐based model type (FP; Figure 1 a) consists of traditional hidden layers, the molecular graph‐based model type uses graph convolutional layers[ 50 , 51 , 52 , 53 , 54 ] (GCN; Figure 1 b). Due to their wide applicability and strong performance,[ 55 , 56 , 57 , 58 , 59 , 60 , 61 , 62 , 63 , 64 , 65 ] graph convolutional neural networks have gained much popularity in recent years, as they can learn specific molecular fragments and variations thereof that are decisive for the prediction of a property, [50] rather than relying on statically defined atom combinations such as in circular fingerprints. A similar methodology could be used for the prediction of solvates, and it could be extended to applications involving two or more atomic or molecular species (e.g. metal‐organic frameworks).
The transformation of a pair of coformers to a prediction of co‐crystal formation is learned using the co‐crystal data available during model training. By adjusting the neural network's internal parameters, the loss parameter, related to the misclassification error on the available training data, is minimized. For the present research, 8050 binary co‐crystals were extracted from the CSD and their constituents were converted to molecular graphs and fingerprint vectors. For the successful application of deep learning, however, a data set of invalid coformer combinations is also needed. A common issue with databases is their recording of successful cases only, not taking failed experiments into account. Therefore, it is impossible to directly extract an evidence‐based list of invalid coformer combinations from the CSD, nor is screening literature for invalid combinations a feasible and unbiased option. To cope with this issue, we generated an equally large invalid co‐crystal set using our link‐prediction method, [45] assigning a statistical likelihood to the existence of a co‐crystal for two coformers based on network science. By restricting the sampled invalid co‐crystals to highly unlikely combinations of coformers that each have at least 5 co‐crystals in the CSD, a balanced invalid co‐crystal set is found, showing a substantial overlap with coformers present in the valid co‐crystal set.
The two model types introduced above are subject to a vast number of adjustable configurational parameters, such as the number of layers, layer sizes, activation function of the layers etc. (Table S2). As each parameter greatly influences the performance of the model types on the data set, it is of paramount importance to tune the model configurations in order to achieve the optimal predictive performance. However, because the space imposed by these configurational parameters is extremely large, it is impossible to manually tune the model configuration and we therefore resorted to using Bayesian Optimization. [66] By iteratively assessing the performance of possible configurations on validation sets that are set aside (using the loss parameter), an optimizer constructs a surrogate model, which is used to seek the most optimal configurations for each model type. Fifty such iterations were performed, producing a ranked list of possible model configurations and their associated performance on validation data sets for each type.
Although being architecturally different, the performance of the five best‐performing FP models and GCN models differs only slightly, and each model has at least an accuracy value of 96 % on its respective validation set (Tables S3 and S4). Moreover, as small differences in the produced validation sets would lead to small changes in performance metrics and hence a different ranking, it is imprudent to select only a single model per type as final predictor. To solve this issue, we decided to group five models of each type with the lowest losses in separate model ensembles (FP ensemble and GCN ensemble; Figure 1 c). These composite models return the average of their individual constituents’ predictions and are likely to improve the overall robustness of the predictor by cancelling out erroneous mispredictions of single models. Furthermore, in an effort to include a larger and more differentiated amount of molecular information for the final prediction, we also combined the results of both model ensembles in a ten‐membered model ensemble (FP + GCN ensemble; Figure 1 c).
Details on the model implementation, dataset generation, model selection and model ensembling procedures are described in the Supporting Information.
In Silico Validation of the Approach
An evaluation of how well the three model ensembles (FP, GCN, and FP + GCN ensembles) can repredict co‐crystals from the data set is obtained with cross‐validation. In such a test, the data set is divided in ten equally large random parts, and each part (serving as a validation set) is, in turn, repredicted by the model ensembles that were trained on the remaining nine parts. This test therefore serves as an internal validition check and first step towards model validation.
All three ensembles demonstrate exceptionally high accuracy values (≥97 % averaged over ten validation sets; Figure S2), revealing the large potential of deep learning for multicomponent crystal prediction. These findings support the notion that rules for co‐crystal formation are encoded in the internal parameters of the neural network models, which in fact define relevant combinations of atomic and molecular fragments. In practice, the reported accuracy suggests that on average more than 19 out of 20 co‐crystals from a random subset are classified correctly based on the information of the remaining co‐crystals in the data set. As differences in performance for the three model ensembles are small and within one another's standard deviations, the FP + GCN ensemble was chosen as final predictor for overall robustness.
The high accuracy values obtained with cross‐validation are only applicable when significant overlap between the coformers in the training and validation sets is present. To mimic the situation in which the target compound is completely absent in the co‐crystal data available from the CSD, we manually removed all valid and invalid co‐crystals for carbamazepine (Figure 1 c) from our data set and trained the FP + GCN ensemble on the remaining data. By comparing the model ensemble's output to the experimental outcome for this substantial set of co‐crystals of carbamazepine together with an additional set of 20 experimentally tested combinations by Roca‐Paixão et al. [38] (out of 75 studied compounds), we then are able to evaluate the performance of our approach for its intended purpose.
Because the ensemble consists of ten members, its output is no longer binary (i.e. 0 or 1) but continuous and can be interpreted as the percentage of models voting for a positive outcome. For the purpose of prediction, values larger than 0.5 are classified as valid and vice versa. Comparison between the true and predicted labels for the structures in Figure 3 leads to an accuracy of 80 % and a precision value of 79 %, again confirming that relevant patterns for co‐crystallization can be learned from co‐crystal data in the CSD, and that these patterns are transferable to unseen cases.
Figure 3.
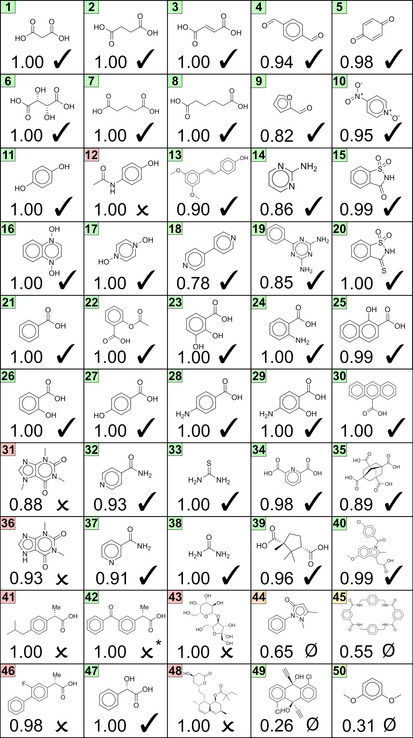
Model output for the coformers in combination with carbamazepine. (checkmark): Experimental proof available. (cross): Not found by Roca‐Paixão et al. [38] (slashed zero): Invalid combination from the data set. True positives (TP): 38. True negatives (TN): 2. False positives (FP): 10. False negatives (FN): 0. The color around the coformer number is related to the error between true and predicted value (continuous spectrum from green (error=0) to red (error=1)). (*): Co‐crystal determined in this work.
Co‐crystals of carbamazepine that were previously verified, were all correctly repredicted with mostly scores of 1.00 and at least 0.78. Invalid combinations (slashed zeros) that were present in the data set are given substantially smaller values, with the emergence of two false positives (coformers 44 and 45). We also compiled the predictions for an additional 67 invalid combinations for carbamazepine (Figure S3) and found that approximately 78 % of invalid co‐crystals scored lower than 0.5. An important result is therefore that the ensemble can discriminate potential coformer couples from combinations that are unable to interact. Yet, some combinations for carbamazepine that were not experimentally found by Roca‐Paixão et al. [38] (crosses) are still given large values. This may indicate that the experimental conditions were possibly not optimal to yield co‐crystalline material for these combinations. On the other hand, although being considered as a “bullet‐proof” method to synthesize thermodynamically stable co‐crystals, Bučar et al. [67] demonstrated that also nucleation issues can potentially hamper co‐crystal formation during grinding. We therefore extended the experimental search for these co‐crystals and have synthesized the co‐crystal of carbamazepine with ketoprofen (coformer 42, vide infra). Moreover, co‐crystals for the combination of carbamazepine with ibuprofen (coformer 41) have also been reported. [68] In addition to a positive prediction, the identification of a real co‐crystal thus also requires the search for and fine‐tuning of the experimental conditions for its actual synthesis.
Application to an Active Pharmaceutical Ingredient (API)
The intended purpose of our approach is to predict co‐crystals of molecules for which experimental data is unavailable. Ketoprofen (see Figure 1 c) is such a case, as it has no co‐crystals in the CSD (and hence our dataset), making it a challenging and perfect candidate to test the approach.
The scoring spectrum of the FP + GCN ensemble for ketoprofen was evaluated for predictions with the 75 most popular coformers as found in the CSD. To gain insight in the correlation between the various coformer types among these 75 molecules and their prediction values, we clustered the coformers based on their number of common co‐crystallization partners. By drawing co‐crystals in the CSD as a physical network, [44] with coformers as its nodes and their co‐crystals as its edges, the similarity between two coformers can be expressed as the number of shared partners (or common neighbors) divided by the combined number of co‐crystallization partners. Coformers that are highly similar are then merged in clusters using Ward's hierarchical grouping method. [69] The result of the clustering is presented as a dendrogram (Figure 4, left), showing the distances at which coformers are merged, where higher distances correspond to more dissimilar coformers (or clusters thereof). The actual coformers in these clusters and their respective predicted values are shown in Figure 5. Additional details are available in the Supporting Information.
Figure 4.
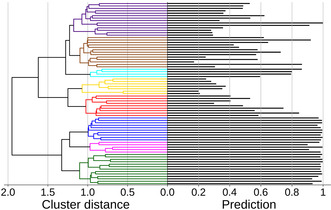
(left) Dendrogram of the 75 most popular coformers in the CSD clustered by Ward's hierarchical method. (right) Predicted values for co‐crystal formation propensity with ketoprofen by the 10‐membered FP + GCN ensemble.
Figure 5.
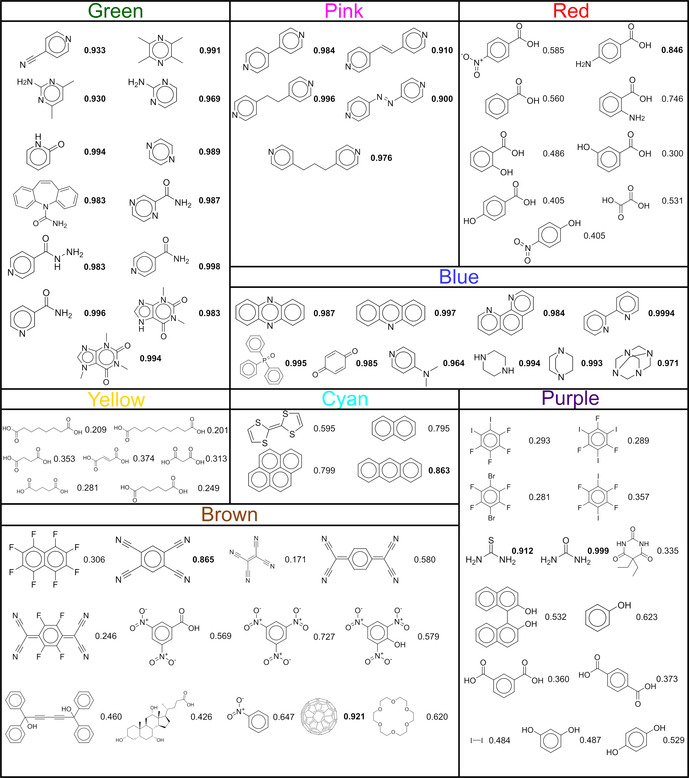
Overview of the molecular structures from Figure 4 and their corresponding prediction values. The structures are ordered from left to right based on their appearance in the dendrogram, and values larger than 0.8 are emphasized.
Members of the green, pink and blue clusters are classified as co‐crystals with a high likelihood of actual formation, and relatively strong intermolecular interactions can indeed be imagined with ketoprofen. In fact, although lacking a full structural characterization, it was reported by Perpétuo et al. [70] that ketoprofen and nicotinamide (green cluster, prediction value of 0.996) form a co‐crystal using the Koffler method (as analyzed by polarized light thermal microscopy and FTIR), supporting the validity of our predictions. Smaller prediction values are found for the cyan cluster (on average 0.75). While the majority of the models of the ensemble recognize π‐π‐interactions between the cluster's molecules and ketoprofen, predictions with a smaller confidence are returned. This is likely due to an underpresentation of co‐crystals bonded solely through π‐π‐interactions in the CSD, resulting in less exposure of such cases during training. The smallest likelihoods of co‐crystal formation are given to the aliphatic dicarboxylic acids in the yellow cluster. Although being omnipresent in other co‐crystals, the ensemble recognizes that pairing the structural features of ketoprofen with two carboxylic acid functionalities is not likely to result in a co‐crystal, as this is unusual in the training data. Our approach can thus identify plausible coformer combinations, and can additionally make suggestions regarding shape and size (decreasing scores in the yellow cluster). Very similar compounds can exhibit distinct/opposite co‐crystallization behaviour as a result of different substitution patterns, which was reported by, for example, Corpinot et al. [71] The question is whether our method shows this level of sophistication. For derivatives of hydroxy‐ and aminobenzoic acids in the red cluster, we observe that the method distinguishes between the relative positions of the substituents.
An eye‐catching prediction is the drug‐drug co‐crystal of ketoprofen with carbamazepine (P cc,ensemble=0.983, Figure 5). This combination was given only a modest likelihood of formation by COSMO‐RS and was not found by liquid‐assisted grinding in methanol. [38] We also made an attempt to synthesize this co‐crystal, and by grinding equimolar mixtures of both racemic and enantiopure ketoprofen with carbamazepine in the presence of a few drops of acetonitrile, two new phases were found (Figures S4 and S5). Crystals obtained from slow evaporation were analyzed with single‐crystal X‐ray diffraction and both proved to be binary co‐crystals (Figures S6 and S7). Not only are these the first reported co‐crystal structures of ketoprofen, but also two of the rare cases where two drugs are found in the same crystal. [72]
Conclusion
This article introduced a new approach for the prediction of binary co‐crystal formation using an ensemble of artifical neural networks. By combining the available binary co‐crystal data in the CSD with a large set of invalid combinations of coformers, it becomes possible to train the neural networks for the prediction of co‐crystal formation. The approach uses the molecular structures of two coformers, and outputs a likelihood for co‐crystal formation based on information extracted from the data set.
In silico validation of the approach demonstrated its excellent performance (accuracy ≥97 %), and accuracy values around 80 % are to be expected for cases where one of the molecules is not found in co‐crystals in the CSD. Ketoprofen is such a case, and an analysis of its predictions highlighted the relation between structural features and model output, and lead to the discovery of a new drug‐drug ketoprofen‐carbamazepine co‐crystal. [73]
The approach is applicable to virtually any molecule (even prior to actual synthesis), and is therefore envisaged to be an attractive tool for drug design and optimization in the pharmaceutical industry. Predictions can be made as soon as the molecular structure of for instance an active substance is proposed or identified, making it useful in the most early stages of the drug pipeline.
Conflict of interest
The authors declare no conflict of interest.
Supporting information
As a service to our authors and readers, this journal provides supporting information supplied by the authors. Such materials are peer reviewed and may be re‐organized for online delivery, but are not copy‐edited or typeset. Technical support issues arising from supporting information (other than missing files) should be addressed to the authors.
Supplementary
Acknowledgements
This research received funding as part of the CORE ITN Project by the European Union's Horizon 2020 Research and Innovation Program under the Marie Skłodowska‐Curie Grant Agreement No. 722456 CORE ITN.
J.-J. Devogelaer, H. Meekes, P. Tinnemans, E. Vlieg, R. de Gelder, Angew. Chem. Int. Ed. 2020, 59, 21711.
A previous version of this manuscript has been deposited on a preprint server (https://doi.org/10.26434/chemrxiv.12452849.v2).
References
- 1. Corpinot M. K., Bučar D.-K., Cryst. Growth Des. 2019, 19, 1426–1453. [Google Scholar]
- 2. Aitipamula S., Banerjee R., Bansal A. K., Biradha K., Cheney M. L., Choudhury A. R., Desiraju G. R., Dikundwar A. G., Dubey R., Duggirala N., Ghogale P. P., Ghosh S., Goswami P. K., Goud N. R., Jetti R. R. K. R., Karpinski P., Kaushik P., Kumar D., Kumar V., Moulton B., Mukherjee A., Mukherjee G., Myerson A. S., Puri V., Ramanan A., Rajamannar T., Reddy C. M., Rodriguez-Hornedo N., Rogers R. D., Row T. N. G., Sanphui P., Shan N., Shete G., Singh A., Sun C. C., Swift J. A., Thaimattam R., Thakur T. S., Kumar Thaper R., Thomas S. P., Tothadi S., Vangala V. R., Variankaval N., Vishweshwar P., Weyna D. R., Zaworotko M. J., Cryst. Growth Des. 2012, 12, 2147–2152. [Google Scholar]
- 3. Grothe E., Meekes H., Vlieg E., ter Horst J. H., de Gelder R., Cryst. Growth Des. 2016, 16, 3237–3243. [Google Scholar]
- 4. Vippagunta S. R., Brittain H. G., Grant D. J. W., Adv. Drug Delivery Rev. 2001, 48, 3–26. [DOI] [PubMed] [Google Scholar]
- 5. Serajuddin A. T. M., Adv. Drug Delivery Rev. 2007, 59, 603–616. [DOI] [PubMed] [Google Scholar]
- 6. Aakeröy C. B., Forbes S., Desper J., J. Am. Chem. Soc. 2009, 131, 17048–17049. [DOI] [PMC free article] [PubMed] [Google Scholar]
- 7. Kalepu S., Nekkanti V., Acta Pharm. Sin. B 2015, 5, 442–453. [DOI] [PMC free article] [PubMed] [Google Scholar]
- 8. Zvoníček V., Skořepová E., Dušek M., Babor M., Žvátora P., Šoóš M., Cryst. Growth Des. 2017, 17, 3116–3127. [Google Scholar]
- 9. Dai X.-L., Chen J.-M., Lu T.-B., CrystEngComm 2018, 20, 5292–5316. [Google Scholar]
- 10. Nauha E., Nissinen M., J. Mol. Struct. 2011, 1006, 566–569. [Google Scholar]
- 11. Honer K., Kalfaoglu E., Pico C., McCann J., Baltrusaitis J., ACS Sustainable Chem. Eng. 2017, 5, 8546–8550. [Google Scholar]
- 12. Hao Z., Iqbal A., Chem. Soc. Rev. 1997, 26, 203–213. [Google Scholar]
- 13. Bučar D.-K., Filip S., Arhangelskis M., O'Lloyd G., Jones W., CrystEngComm 2013, 15, 6289–6291. [Google Scholar]
- 14. Thakuria R., Delori A., Jones W., Lipert M. P., Roy L., Rodríguez-Hornedo N., Int. J. Pharm. 2013, 453, 101–125. [DOI] [PubMed] [Google Scholar]
- 15. Shaikh R., Singh R., Walker G. M., Croker D. M., Trends Pharmacol. Sci. 2018, 39, 1033–1048. [DOI] [PubMed] [Google Scholar]
- 16. Thakuria R., Sarma B., Crystals 2018, 8, 101. [Google Scholar]
- 17. Aakeröy C. B., Salmon D. J., CrystEngComm 2005, 7, 439–448. [DOI] [PMC free article] [PubMed] [Google Scholar]
- 18. Allesø M., van den Berg F., Cornett C., Jørgensen F. S., Halling-Sørensen B., de Diego H. L., Hovgaard L., Aaltonen J., Rantanen J., J. Pharm. Sci. 2008, 97, 2145–2159. [DOI] [PubMed] [Google Scholar]
- 19. Kumar L., Amin A., Bansal A. K., Drug Discovery Today 2007, 12, 1046–1053. [DOI] [PubMed] [Google Scholar]
- 20. Casares A. F., Nap W. M., Figás G. T., Huizenga P., Groot R., Hoffmann M., J. Pharm. Pharmacol. 2015, 67, 812–822. [DOI] [PubMed] [Google Scholar]
- 21. Galek P. T. A., Fábián L., Motherwell W. D. S., Allen F. H., Feeder N., Acta Crystallogr. Sect. B 2007, 63, 768–782. [DOI] [PubMed] [Google Scholar]
- 22. Delori A., Galek P. T. A., Pidcock E., Jones W., Chem. Eur. J. 2012, 18, 6835–6846. [DOI] [PubMed] [Google Scholar]
- 23. Delori A., Galek P. T. A., Pidcock E., Patni M., Jones W., CrystEngComm 2013, 15, 2916–2928. [Google Scholar]
- 24. Wood P. A., Feeder N., Furlow M., Galek P. T. A., Groom C. R., Pidcock E., CrystEngComm 2014, 16, 5839–5848. [Google Scholar]
- 25. Fábián L., Cryst. Growth Des. 2009, 9, 1436–1443. [Google Scholar]
- 26. Karki S., Friščić T., Fábián L., Jones W., CrystEngComm 2010, 12, 4038–4041. [Google Scholar]
- 27. Wicker J. G. P., Crowley L. M., Robshaw O., Little E. J., Stokes S. P., Cooper R. I., Lawrence S. E., CrystEngComm 2017, 19, 5336–5340. [Google Scholar]
- 28. Hunter C. A., Angew. Chem. Int. Ed. 2004, 43, 5310–5324; [DOI] [PubMed] [Google Scholar]; Angew. Chem. 2004, 116, 5424–5439. [Google Scholar]
- 29. Grecu T., Hunter C. A., Gardiner E. J., McCabe J. F., Cryst. Growth Des. 2014, 14, 165–171. [Google Scholar]
- 30. Aakeröy C. B., Wijethunga T. K., Desper J., J. Mol. Struct. 2014, 1072, 20–27. [Google Scholar]
- 31. Aakeröy C. B., Wijethunga T. K., Desper J., New J. Chem. 2015, 39, 822–828. [Google Scholar]
- 32. Perera M. D., Desper J., Sinha A. S., Aakeröy C. B., CrystEngComm 2016, 18, 8631–8636. [Google Scholar]
- 33. Cruz-Cabeza A. J., Day G. M., Jones W., Chem. Eur. J. 2008, 14, 8830–8836. [DOI] [PubMed] [Google Scholar]
- 34. Issa N., Karamertzanis P. G., Welch G. W. A., Price S. L., Cryst. Growth Des. 2009, 9, 442–453. [Google Scholar]
- 35. Karamertzanis P. G., Kazantsev A. V., Issa N., Welch G. W., Adjiman C. S., Pantelides C. C., Price S. L., J. Chem. Theory Comput. 2009, 5, 1432–1448. [DOI] [PubMed] [Google Scholar]
- 36. Taylor C. R., Day G. M., Cryst. Growth Des. 2018, 18, 892–904. [DOI] [PMC free article] [PubMed] [Google Scholar]
- 37. Loschen C., Klamt A., Cryst. Growth Des. 2018, 18, 5600–5608. [Google Scholar]
- 38. Roca-Paixão L., Correia N. T., Affouard F., CrystEngComm 2019, 21, 6991–7001. [Google Scholar]
- 39. Barua H., Gunnam A., Yadav B., Nangia A., Shastri N. R., CrystEngComm 2019, 21, 7233–7248. [Google Scholar]
- 40. Gavezzotti A., J. Phys. Chem. B 2002, 106, 4145–4154. [Google Scholar]
- 41. Gavezzotti A., J. Phys. Chem. B 2003, 107, 2344–2353. [Google Scholar]
- 42. Spackman M. A., Byrom P. G., Chem. Phys. Lett. 1997, 267, 215–220. [Google Scholar]
- 43.M. Turner, J. McKinnon, S. Wolff, D. Grimwood, P. Spackman, D. Jayatilaka, M. A. Spackman, “CrystalExplorer17”, 2017, can be found under https://hirshfeldsurface.net.
- 44. Devogelaer J. J., Meekes H., Vlieg E., de Gelder R., Acta Crystallogr. Sect. B 2019, 75, 371–383. [DOI] [PubMed] [Google Scholar]
- 45. Devogelaer J. J., Brugman S. J. T., Meekes H., Tinnemans P., Vlieg E., de Gelder R., CrystEngComm 2019, 21, 6875–6885. [Google Scholar]
- 46. Groom C. R., Bruno I. J., Lightfoot M. P., Ward S. C., Acta Crystallogr. Sect. B 2016, 72, 171–179. [DOI] [PMC free article] [PubMed] [Google Scholar]
- 47. LeCun Y., Bengio Y., Hinton G., Nature 2015, 521, 436–444. [DOI] [PubMed] [Google Scholar]
- 48. Dietterich T. G., Multiple Classifier Systems, Berlin, Heidelberg, 2000, pp. 1–15. [Google Scholar]
- 49. Rogers D., Hahn M., J. Chem. Inf. Model. 2010, 50, 742–754. [DOI] [PubMed] [Google Scholar]
- 50. Duvenaud D. K., Maclaurin D., Iparraguirre J., Bombarell R., Hirzel T., Aspuru-Guzik A., Adams R. P. in Advances in Neural Information Processing Systems 28 (Eds.: Cortes C., Lawrence N. D., Lee D. D., Sugiyama M., Garnett R.), Curran Associates, Inc., Red Hook, 2015, pp. 2224–2232. [Google Scholar]
- 51.T. N. Kipf, M. Welling, 2016, arXiv preprint arXiv:1609.02907 [cs stat].
- 52. Kearnes S., McCloskey K., Berndl M., Pande V., Riley P., J. Comput.-Aided Mol. Design 2016, 30, 595–608. [DOI] [PMC free article] [PubMed] [Google Scholar]
- 53. Gilmer J., Schoenholz S. S., Riley P. F., Vinyals O., Dahl G. E., Proceedings of the 34th International Conference on Machine Learning—Volume 70, 2017, pp. 1263–1272. [Google Scholar]
- 54.M. Defferrard, X. Bresson, P. Vandergheynst, 2017, arXiv preprint arXiv:1606.09375 [cs stat].
- 55. Wu Z., Ramsundar B., Feinberg E. N., Gomes J., Geniesse C., Pappu A. S., Leswing K., Pande V., Chem. Sci. 2018, 9, 513–530. [DOI] [PMC free article] [PubMed] [Google Scholar]
- 56. Xie T., Grossman J. C., Phys. Rev. Lett. 2018, 120, 145301. [DOI] [PubMed] [Google Scholar]
- 57. Feinberg E. N., Sur D., Wu Z., Husic B. E., Mai H., Li Y., Sun S., Yang J., Ramsundar B., Pande V. S., ACS Cent. Sci. 2018, 4, 1520–1530. [DOI] [PMC free article] [PubMed] [Google Scholar]
- 58. Mater A. C., Coote M. L., J. Chem. Inf. Model. 2019, 59, 2545–2559. [DOI] [PubMed] [Google Scholar]
- 59. Coley C. W., Jin W., Rogers L., Jamison T. F., Jaakkola T. S., Green W. H., Barzilay R., Jensen K. F., Chem. Sci. 2019, 10, 370–377. [DOI] [PMC free article] [PubMed] [Google Scholar]
- 60. Roszak R., Beker W., Molga K., Grzybowski B. A., J. Am. Chem. Soc. 2019, 141, 17142–17149. [DOI] [PubMed] [Google Scholar]
- 61. Ishida S., Terayama K., Kojima R., Takasu K., Okuno Y., J. Chem. Inf. Model. 2019, 59, 5026–5033. [DOI] [PubMed] [Google Scholar]
- 62. Korolev V., Mitrofanov A., Korotcov A., Tkachenko V., J. Chem. Inf. Model. 2020, 60, 22–28. [DOI] [PubMed] [Google Scholar]
- 63. Mayr A., Klambauer G., Unterthiner T., Steijaert M., Wegner J. K., Ceulemans H., Clevert D.-A., Hochreiter S., Chem. Sci. 2018, 9, 5441–5451. [DOI] [PMC free article] [PubMed] [Google Scholar]
- 64. Yang K., Swanson K., Jin W., Coley C., Eiden P., Gao H., Guzman-Perez A., Hopper T., Kelley B., Mathea M., Palmer A., Settels V., Jaakkola T., Jensen K., Barzilay R., J. Chem. Inf. Model. 2019, 59, 3370–3388. [DOI] [PMC free article] [PubMed] [Google Scholar]
- 65. Stokes J. M., Yang K., Swanson K., Jin W., Cubillos-Ruiz A., Donghia N. M., MacNair C. R., French S., Carfrae L. A., Bloom-Ackerman Z., Tran V. M., Chiappino-Pepe A., Badran A. H., Andrews I. W., Chory E. J., Church G. M., Brown E. D., Jaakkola T. S., Barzilay R., Collins J. J., Cell 2020, 180, 688–702. [DOI] [PMC free article] [PubMed] [Google Scholar]
- 66. Shahriari B., Swersky K., Wang Z., Adams R. P., de Freitas N., Proc. IEEE 2016, 104, 148–175. [Google Scholar]
- 67. Bučar D.-K., Day G. M., Halasz I., Zhang G. G. Z., Sander J. R. G., Reid D. G., MacGillivray L. R., Duer M. J., Jones W., Chem. Sci. 2013, 4, 4417–4425. [Google Scholar]
- 68. Abd Rahim S., Rosli N. A., Mohd Khalid S. S., Adv. Mater. Res. 2015, 1113, 417–421. [Google Scholar]
- 69. Ward J. H. J., J. Am. Stat. Assoc. 1963, 58, 236–244. [Google Scholar]
- 70. Perpétuo G. L., Chierice G. O., Ferreira L. T., Fraga-Silva T. F. C., Venturini J., Arruda M. S. P., Bannach G., Castro R. A. E., Thermochim. Acta 2017, 651, 1–10. [Google Scholar]
- 71. Corpinot M. K., Stratford S. A., Arhangelskis M., Anka-Lufford J., Halasz I., Judaš N., Jones W., Bučar D.-K., CrystEngComm 2016, 18, 5434–5439. [Google Scholar]
- 72. Sekhon B. S., DARU J. Pharm. Sci. 2012, 20, 45. [Google Scholar]
- 73.Deposition numbers 2010395 and 2010396 contain the supplementary crystallographic data for this paper. These data are provided free of charge by the joint Cambridge Crystallographic Data Centre and Fachinformationszentrum Karlsruhe Access Structures service.
Associated Data
This section collects any data citations, data availability statements, or supplementary materials included in this article.
Supplementary Materials
As a service to our authors and readers, this journal provides supporting information supplied by the authors. Such materials are peer reviewed and may be re‐organized for online delivery, but are not copy‐edited or typeset. Technical support issues arising from supporting information (other than missing files) should be addressed to the authors.
Supplementary