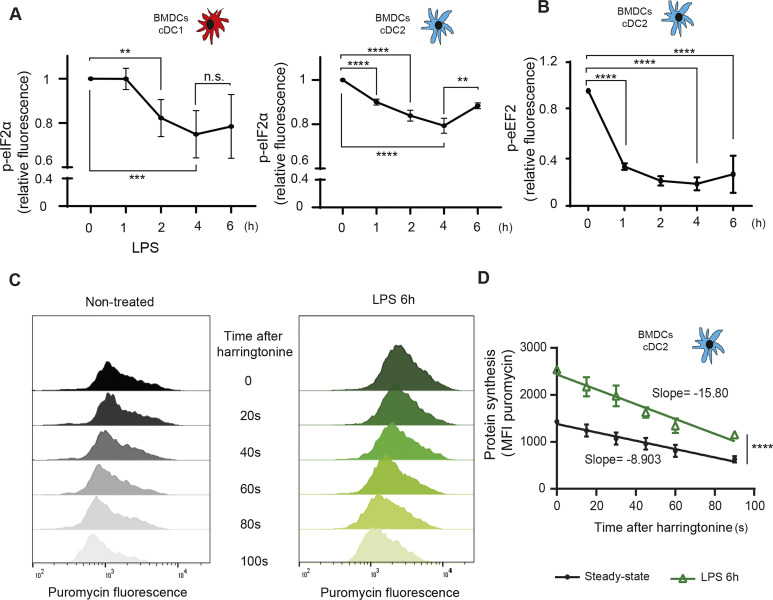
Figure 3. P-eIF2α and p-eEF2 levels are down-regulated upon LPS stimulation.
Flt3-L BMDCs were stimulated with LPS (100 ng/ml) for indicated hours. (A, B) Monitoring of p-eIF2α and (B) p-eEF2 by intracellular flow in CDC1 and cDC2. (C) Flow detection of puromycin incorporation was performed on the cDC2 population. Total puromycin mean fluorescence intensity between steady-state and LPS activated cDC2 is shown for different time of harringtonine treatment. (D) Mean fluorescence intensity was plotted as a decay slope and establish the speed of translation elongation. All data are representative of n = 3 independent experiments. Data represent mean ± SD of three independent experiments. (A, B, C, D) Statistical analysis was performed using Dunnett’s multiple comparison (A, B, C, D) Mann–Whitney test (**P < 0.01 and ****P < 0.0001).

