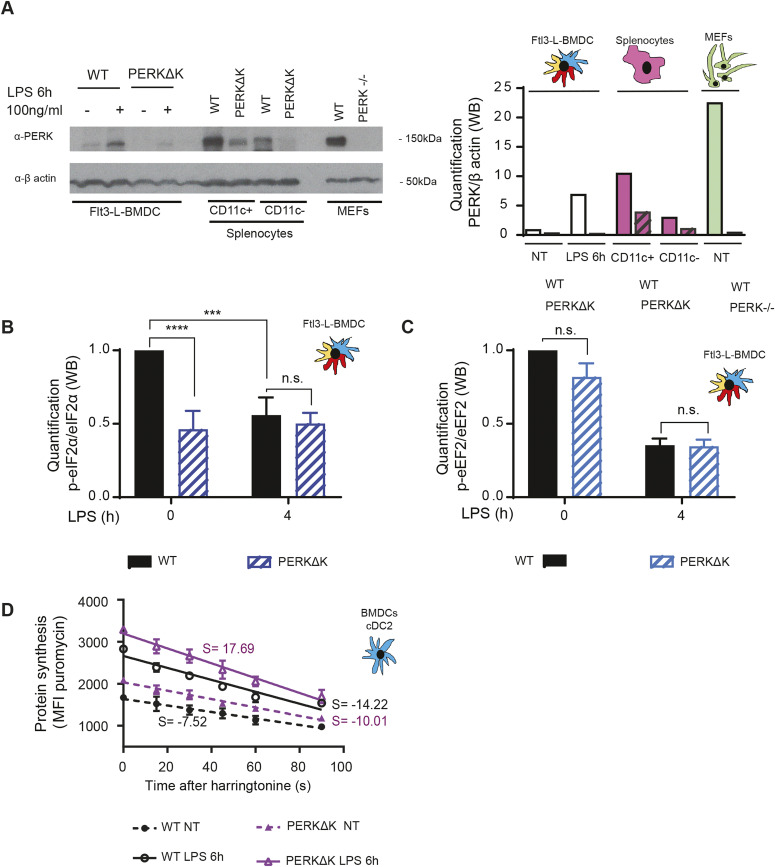
Figure 5. PERK is activated in steady-state DCs.
(A) Immunoblot detection of PERK and β-actin. Quantification is shown on the right. WT and PERKΔK Flt3-L BMDC treated or not with LPS (100 ng/ml) for 6 h were compared with CD11c+ and CD11c− fractions of splenocytes. WT and PERK−/− MEFs were used as control. (B, C) WT and Flt3-L PERKΔK BMDCs were stimulated or not with LPS (100 ng/ml) for 4 h. (B) Quantification of p-eIF2α/eIF2α ratio (immunoblot). (C) Quantification of p-eEF2/eEF2 ratio (immunoblot). (D) The speed of translation elongation was measured using SunRISE in Flt3-L cDC2 after 4 h of incubation with LPS. The total decay of puromycin mean fluorescence intensity between WT and PERKΔK in steady-state and upon activation is showed. All data are representative of n = 3 independent experiments. (B, C, D) Statistical analysis was performed using Wilcoxon test (B, C) and Mann–Whitney test (D). Data in (D) represent mean fluorescence intensity ± SD of three independent experiments (**P < 0.01, ***P < 0.001, and ****P < 0.0001).

