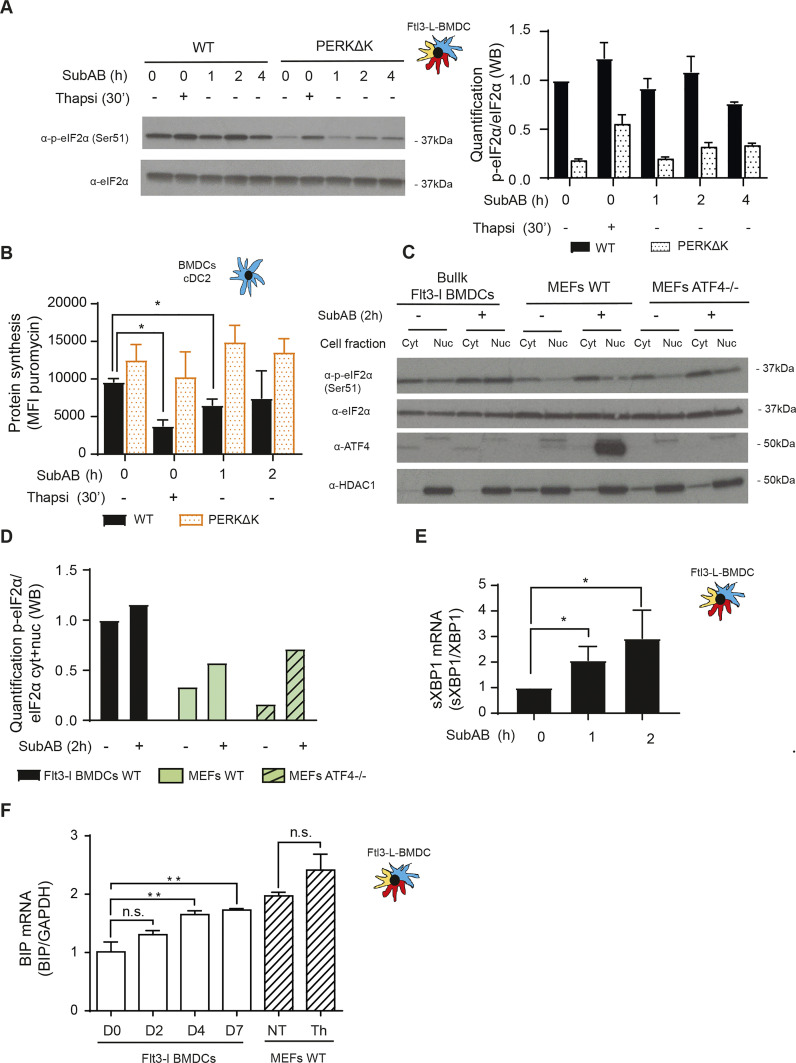
Figure 6. Flt3-L BMDCs are resistant to subtilase cytotoxin-induced integrated stress response.
WT and PERKΔK Flt3-L BMDCs were stimulated with thapsigargin (200 nM) and subtilase cytotoxin (SubAB, 250 ng/ml) for the indicated times. (A) Levels of p-eIF2α and total eIF2α detected by immunoblot (left) and quantified (right). (B) Levels of protein synthesis measured by flow using puromycilation detection in cDC2. Cells were incubated with puromycin 10 min before harvesting. The graph shows the total puromycin mean fluorescence intensity levels. (C) WT Flt3-L BMDCs, WT and ATF4−/− MEFs were stimulated with subtilase cytotoxin (SubAB, 250 ng/ml) for 2 h. Both cytoplasmic (cyt) and nuclear (nuc) fractions were analyzed. Levels of p-eIF2α, total eIF2α, ATF4, and HDAC1 (nuclear loading control) were revealed by immunoblot. (D) p-eIF2α quantification is represented in (D). (E) WT Flt3-L BMDCs were stimulated with subtilase cytotoxin (SubAB, 250 ng/ml) for the indicated times. mRNA levels of spliced XBP1 were measured by qRT-PCR in bulk Flt3-L BMDCs. Raw data were normalized to total XBP1 mRNA expression. (F) Levels of BiP mRNA expression measured by qRT-PCR during Flt3-L BMDCs differentiation and in MEFs stimulated with thapsigargin for 30 min. Data are mean ± SD (n = 3). Statistical analysis was performed using Dunnett’s multiple comparison (*P < 0.05 and **P < 0.01).

