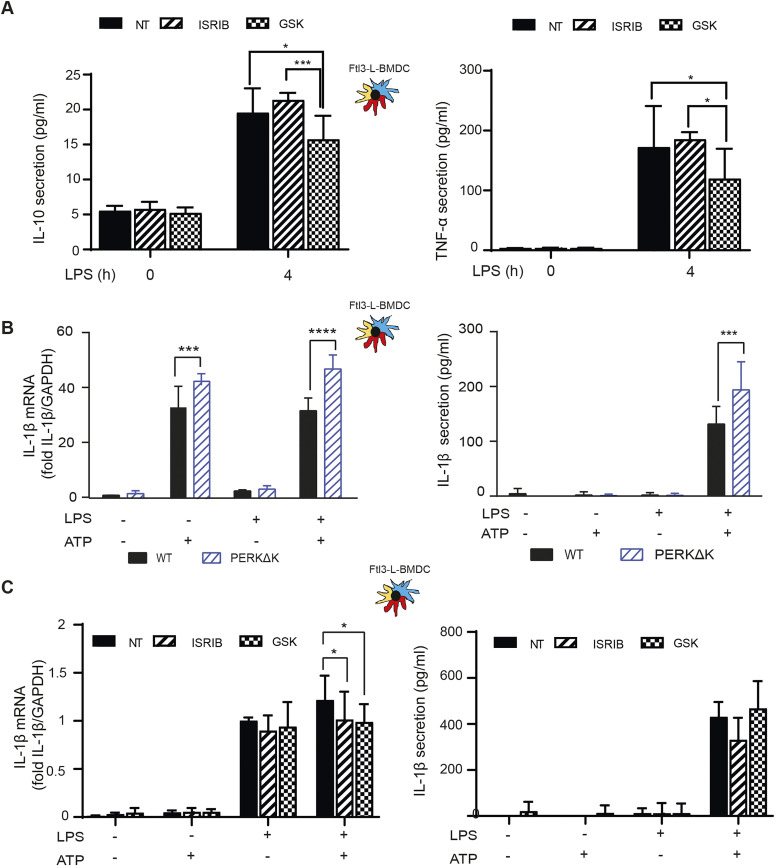
Figure 8. PERK inactivation and cytokines expression.
(A) IL-10 and TNF secretion was measured by Legendplex in Flt3-L BMDCs activated with LPS and treated or not with ISRIB or GSK2656157 for 4 h. (B) IL-1β mRNA expression measured by qRT-PCR (left) and secretion by ELISA (right) in WT and PERKΔK Flt3-L BMDCs stimulated with LPS during 4 h and with ATP for the last 30 min of treatment. (C) IL-1β mRNA expression measured by qRT-PCR (left) and secretion by ELISA (right) in Flt3-L BMDCs activated with LPS and treated with GSK2656157 and/or ISRIB for 4 h and with ATP for the last 30 min of treatment. (A, B, C) Statistical analysis was performed using Dunnett’s multiple comparison (A, B) and Wilcoxon test (C). Data are mean ± SD (n = 3). independent experiments (*P < 0.05, **P < 0.01, and ***P < 0.001).

