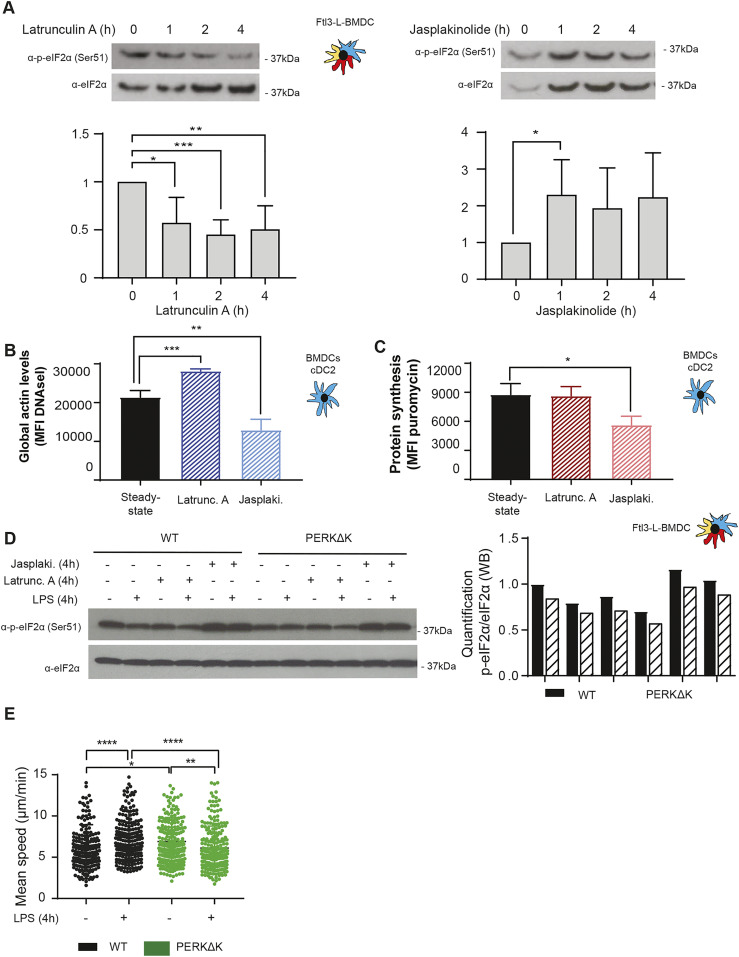
Figure 9. eIF2α phosphorylation levels are regulated by G-actin availability.
WT Flt3-L BMDCs were treated with Latrunculin A (50 nM) (Latrunc A) and Jasplakinolide (1 μM) (Jasp) for the indicated times. (A) Levels of p-eIF2α and total eIF2α detected by immunoblot in Flt3-L BMDCs. (B) Globular actin levels were measured by flow cytometry intracellular staining using a fluorochrome coupled DNAse I protein in cDC2 population from Flt3-L BMDCs. The graph shows total mean fluorescence intensity levels. (C) Levels of protein synthesis in cDC2 were measured by puromycilation and flow intracellular staining. Cells were incubated with puromycin 10 min before harvesting. The graph shows total puromycin mean fluorescence intensity levels. WT and PERKΔK Flt3-L BMDCs were treated with LPS (100 ng/ml), Latrunc A, and Jasp for 4 h. (D) Levels of p-eIF2α and total eIF2α monitored by immunoblot in Flt3-L BMDCs. Quantification is shown on the right. (E) WT and PERKΔK GM-CSF BMDCs were treated with LPS (100 ng/ml) d—uring 30 min previous to 16 h of migration. The graph represents instantaneous mean velocities of migration in 4 × 5-μm fibronectin-coated microchannels of at least 100 cells per condition. All data are representative of n = 3 independent experiments. (A, B, C) Statistical analysis was performed using Dunnett’s multiple comparison (A) and Mann–Whitney test (B, C). Data are mean ± SD (n = 3). *P < 0.05, **P < 0.01, ***P < 0.001, and ****P < 0.0001.

