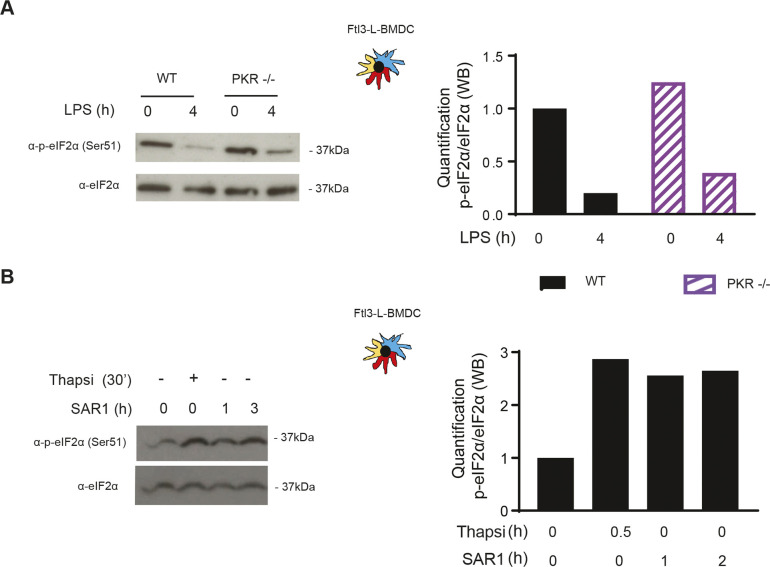
Figure S3. Inhibition of PKR and GCN2 does not alter steady-state p-eIF2α levels.
(A) WT and PKR−/− Flt3-L BMDCs were stimulated with LPS (100 ng/ml) during 4 h. Levels of p-eIF2α and total eIF2α are shown by immunoblot and the respective quantification is represented in the graph on the right. (B) WT Flt3-L BMDCs were stimulated with SAR1, a specific inhibitor of PKR and GCN2 kinases (1 μM) and thapsigargin (200 nM) for the indicated times. Levels of p-eIF2α and total eIF2α are shown by immunoblot and the respective quantification is represented in the graph on the right.

