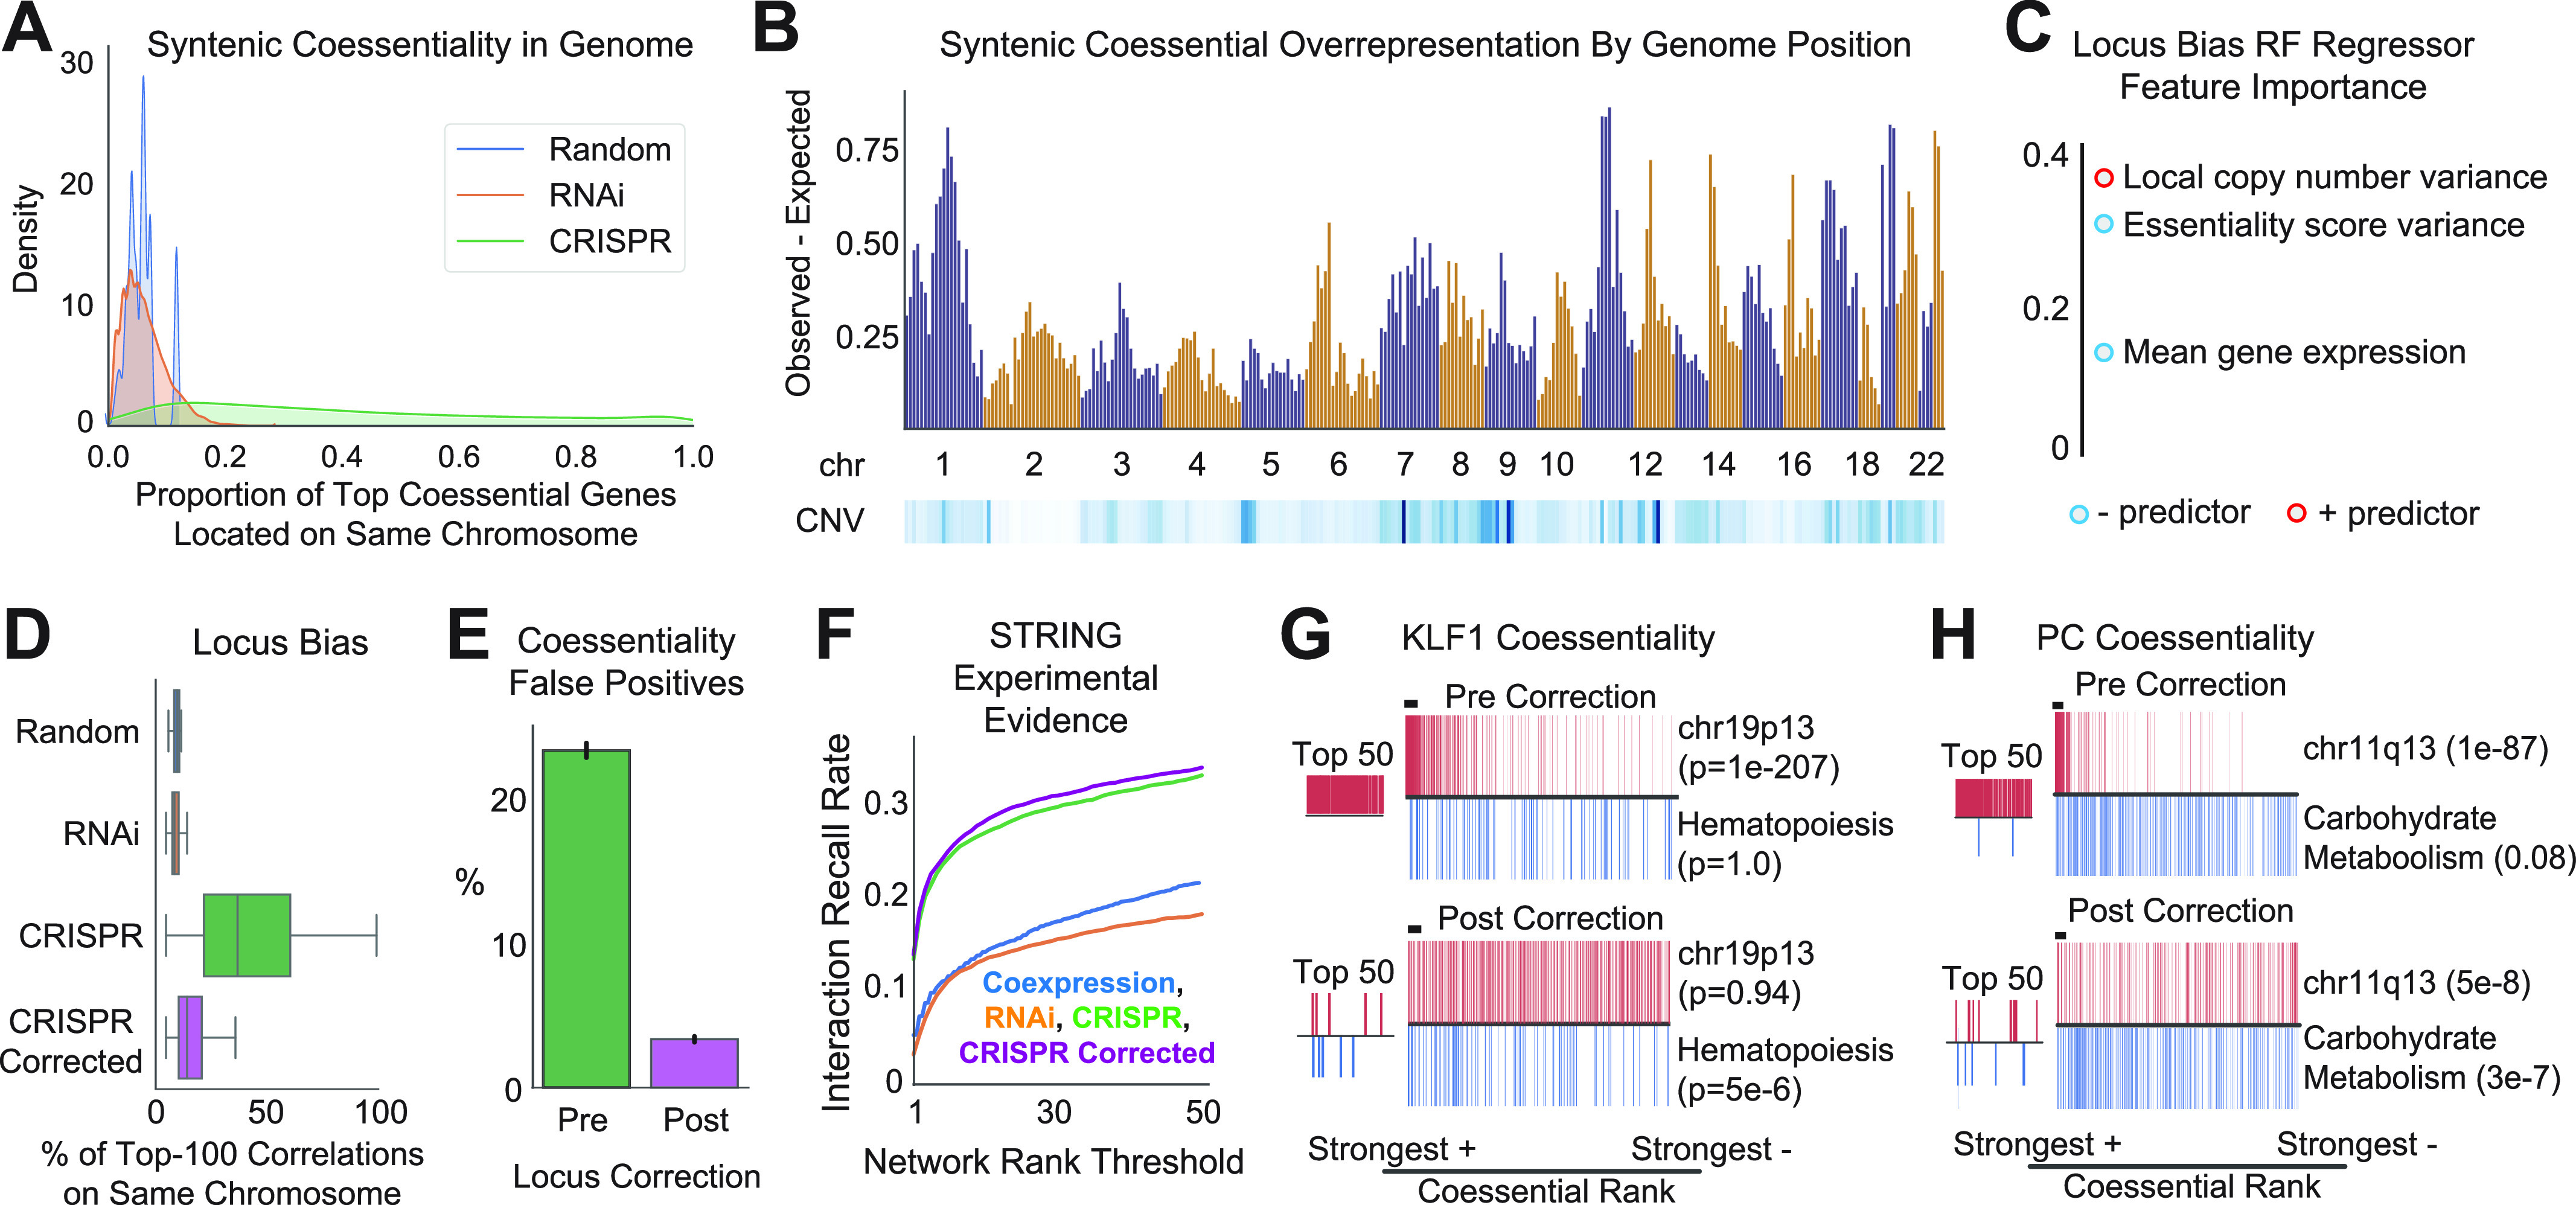
Figure 2. Correction of genomic locus bias reduces false positives and increases predictive power in CRISPR coessentiality analysis.

(A) Genome-scale distribution of the fraction of each gene’s top 100 ranked fitness correlations which are co-localized in the same chromosomal band. Random indicates frequency based on chromosome gene content, whereas RNAi indicates coessentiality computed using shRNA screen data. CRISPR data and RNAi data stem from 739 and 712 cell lines, respectively. (B) Median locus bias (syntenic coessentiality rate observed minus maximum expected from RNAi coessentiality or random chance) and copy number variability (CNV; blue is higher variability) for chromosomal band neighborhoods across the genome. (C) Gini importance, a measure of the power of a feature to reduce model uncertainty, of gene-level features in a Random Forest regression model trained to predict locus bias. (D) The neighbor subtraction preprocessing approach for locus correction (see the Materials and Methods section and Fig S2) reduces the burden of locus-biased false positives in CRISPR coessentiality analysis. (E) Presumed false positives (syntenic correlations beyond threefold expected by either chance or RNAi coessentiality) comprise 23% and 3% of the average gene’s top 50 ranked correlations before and after correction, respectively. (F) Locus-corrected CRISPR coessentiality data identifies more true positive experimental interactions than non-corrected CRISPR coessentiality, RNAi coessentiality, and transcript co-expression datasets. (G, H) The coessentiality profile of highly locus-biased genes before and after locus correction reveals increased prioritization of known relationships and a reduction in locus-associated false positives. P-value from hypergeometric test.
