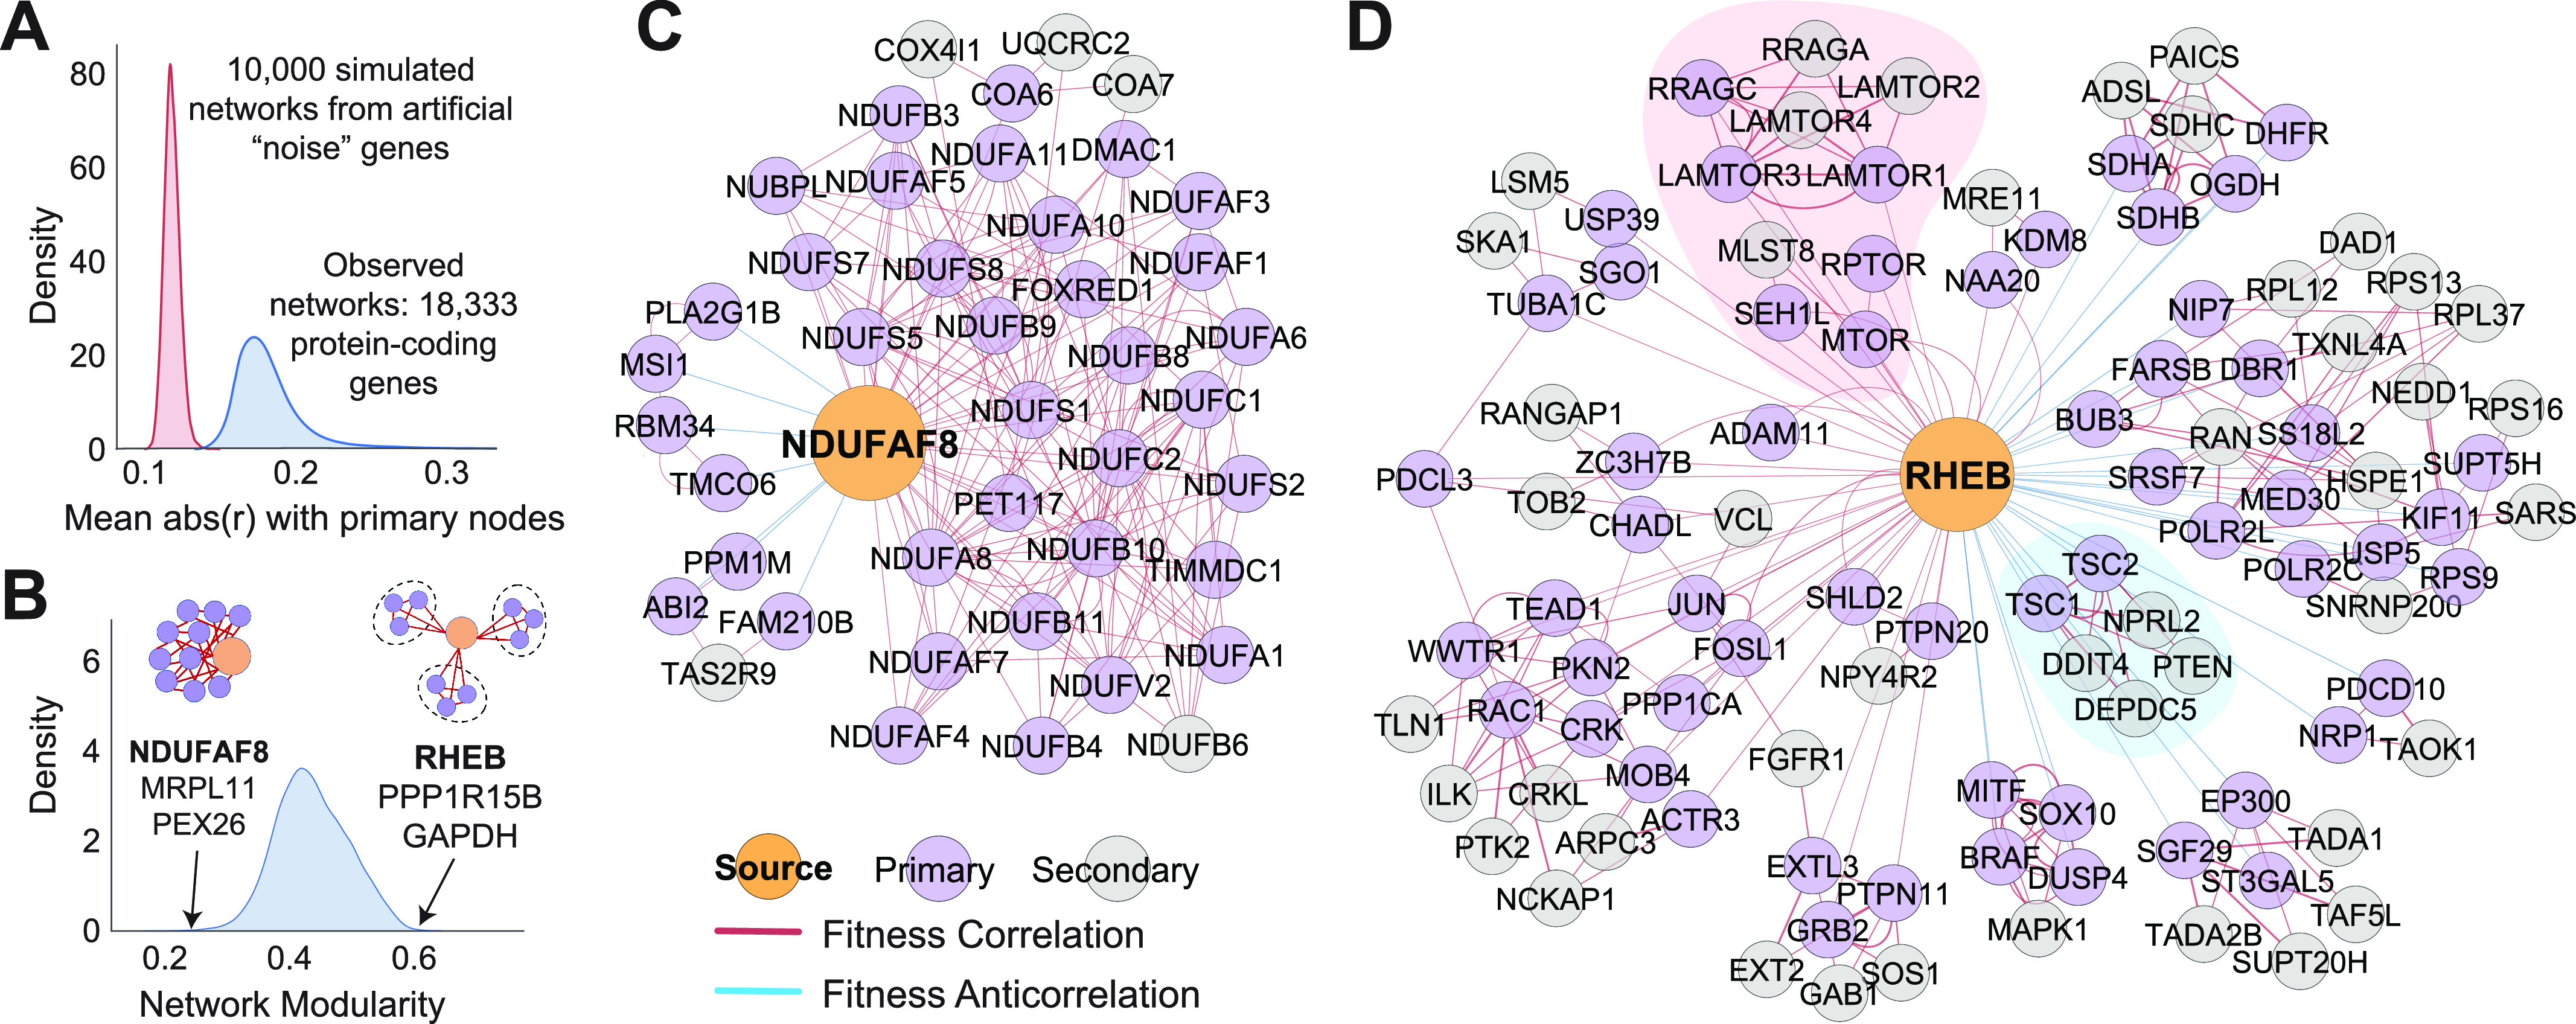
Figure 3. Construction of a bottom-up coessentiality network for every gene in the genome.

(A) A standard bottom-up coessentiality network, as described in text, was created for every gene in the genome as well as 10,000 simulated fitness profiles created from random sampling of gene essentiality data. The average absolute magnitude of the Pearson correlation for the primary connections observed from actual genes was all stronger than at least 99.5% of simulated networks. (B) Modularity of each gene’s bottom-up coessentiality network after application of Louvain’s algorithm for community detection. Examples of low-modularity and high-modularity networks are highlighted. (C) NDUFAF8, a component of complex I in the electron transport chain, is an example of a low-modularity network dominated by genes related to oxidative phosphorylation. (D) RHEB, a small GTPase involved in mTORC1 regulation, is an example of a high modularity network containing many clusters of densely interconnected genes. The red module represents genes involved in mTORC1 activation downstream of RHEB and the blue module represents the TSC1-TSC2 complex which negatively regulates RHEB to inactivate mTORC1 signaling. Note that double looping (two connections between a given gene pair) indicates that the correlation relationship is among the top-ranked for both genes at the specified rank thresholds (here, 30 for primary nodes and 5 for secondary nodes).
