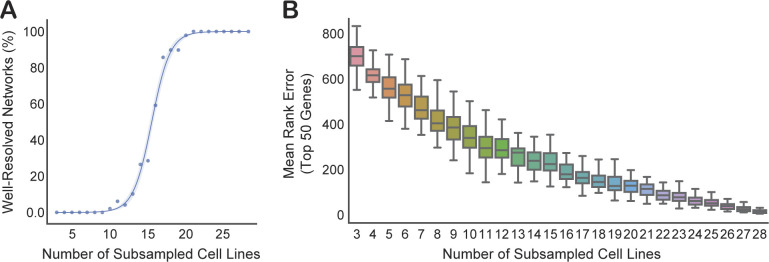
Figure S5. Performance of correlation matrices derived from subsets of cell lines within a lineage.
Cell lines from the bone lineage (n = 29) were randomly sampled 50 times at each threshold, from three cell lines to 28 cell lines. (A) Proportion of genes whose top 50 coessentiality network members, as defined by the whole-lineage coessentiality analysis, were still highly coessential (average correlation rank, top decile) in the subsampled dataset at different sampling thresholds. (B) The mean absolute difference (error) in rank position for genes in full-sample network as compared with the subsampled dataset.

