
Fig. 3. MOA hypothesis of turbinmicin.
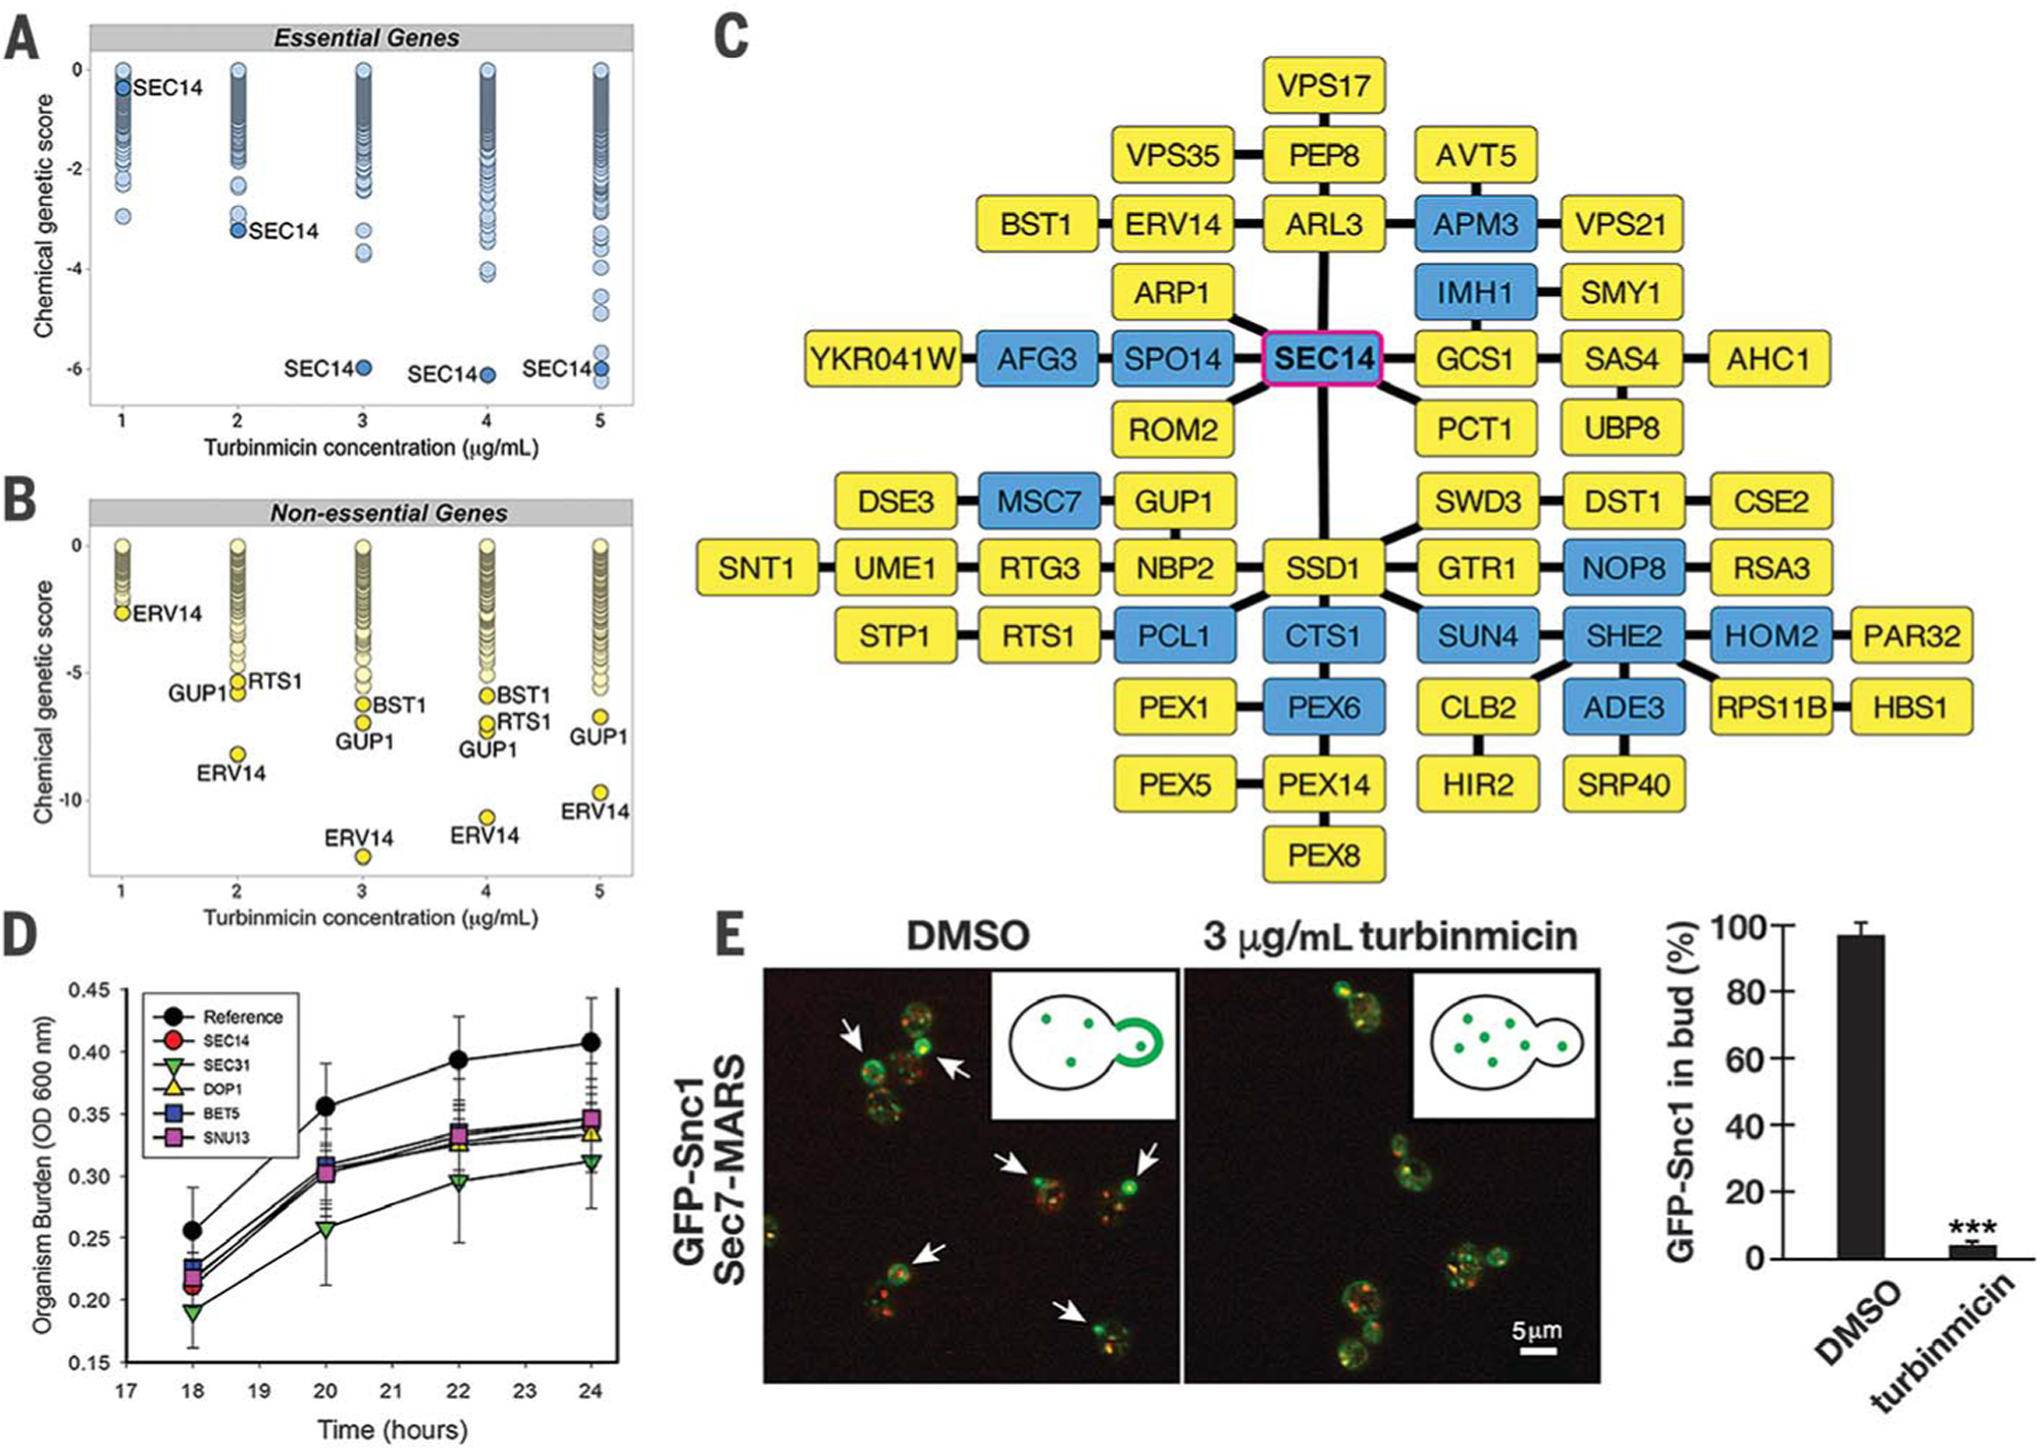
Dose-wise chemical-genetic profiles of turbinmicin against the S. cerevisiae DAmP essential gene pool (A) and the diagnostic nonessential gene pool (B). Mean negative chemical-genetic interactions are represented in green [n = 6 except for 2 μg/mL turbinmicin in (C), in which n = 5]. (C) Resulting TransposeNET genetic interaction network built by using sensitive, nonessential gene mutants. Input genes are represented by yellow nodes, and “hidden” nodes are represented in blue. SEC14 was a hidden node and highlighted with a magenta border. (D) Time-kill curve for turbinmicin against wild type and C. albicans mutants. Mutant C. albicans SEC14 H1 5C10, DOP1 H1 27E12, BET5 H1 5C5, SUN13 H1 4B5, SEC31 H1(PGA63) 29A6, and SEC31 H1(PGA63) 51H11 were used in this study. OD, optical density. (E) Representative images of GFP-Snc1 localization (green) relative to Golgi membranes (red) in the presence and absence of 3 μg/mL turbinmicin (five biological replicates each and at least 100 cells examined per condition; ***P < 0.001 based on a t test; error bars are SEM). Spectroscopy with pure turbinmicin (3 μg/mL) revealed fluorescence properties distinct and noninterfering with respect to those of the GFP and MARS (mRFPmars). Arrows highlight the distribution of GFP-Snc1 in buds in the absence of turbinmicin (also shown in the graphic). Scale bar, 5 μm. DMSO, dimethyl sulfoxide.