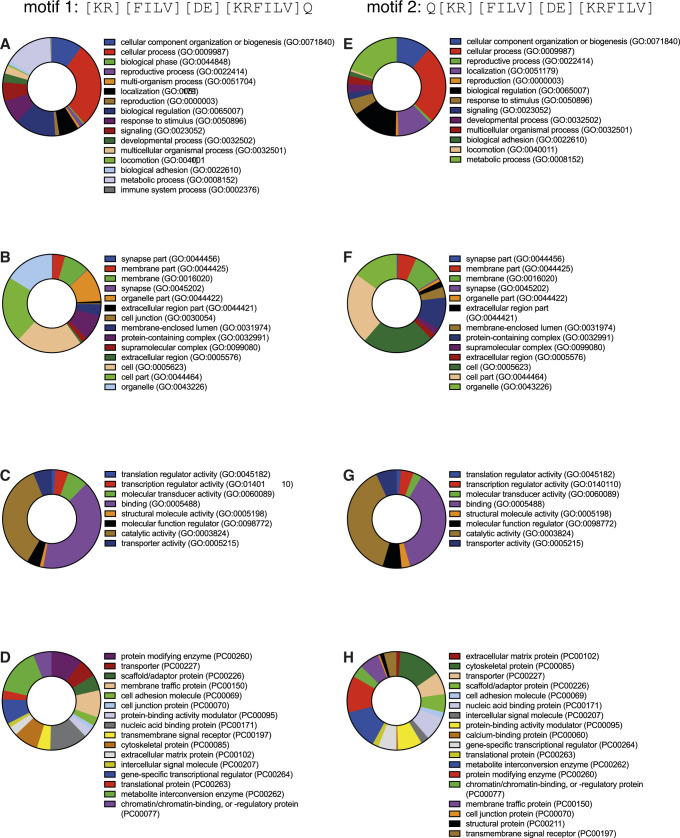
Figure S1. KFERQ-like motif-containing proteins were analysed by the PANTHER classification system.
(A, B, C, D, E, F, G, H) GO-slim classifications are shown for motif 1 ([KR][FILV][DE][KRFILV]Q) (A, B, C, D) and motif 2 (Q[KR][FILV][DE][KRFILV]) (E, F, G, H) with percentage of gene hits amongst the total genes for each function shown. (A, E) Biological process terms. (B, F) Cellular component terms. (C, G) Molecular function terms. (D, H) Protein class categories are defined in each key and in order as appears on the charts.

