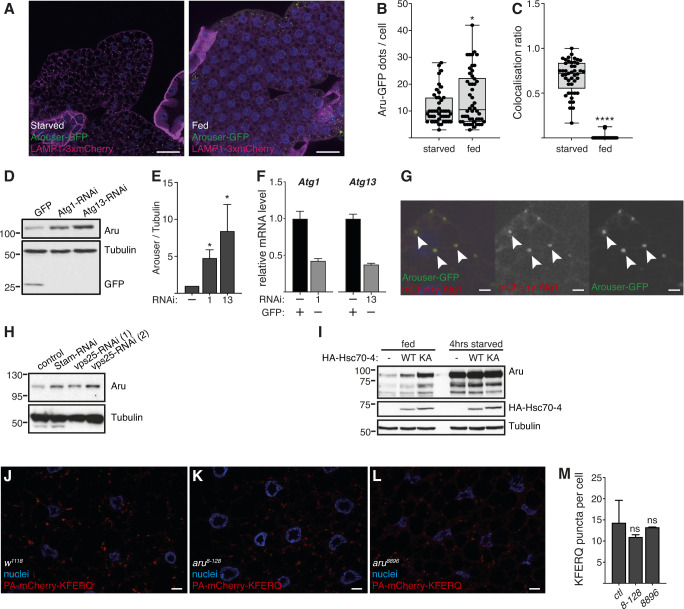
Figure S2. Arouser is associated with endosomal microautophagy.
(A) Confocal section of larval fat bodies from 4-h starved or fed larvae expressing Arouser-GFP (green) and the lysosomal marker LAMP1-3xmCherry (red). Nuclei were stained with Hoechst (blue). Scale bar: 50 μm. (B, C) Quantification of the number of Arouser-GFP dots per cells (B) and colocalisation ration between Arouser-GFP and LAMP1-3xmCherry (C). Box and whiskers charts show the distribution and s.d. of all the samples. (D, E) Western blot analysis and quantification of Arouser protein level in Atg1 and Atg13 knockdown larvae post heat-shock. The expression of a GFP control was used to ensure the efficiency of the heat shock. (F) Relative gene expression of Atg1 and Atg13 in control and RNAi expressing larvae. (G) Colocalisation of Arouser-GFP and mCherry-Atg1 in larval fat body cells. Scale bars: 10 μm. (H) Western blot analysis of Arouser protein level in fed larvae expressing RNAi against ESCRT components Stam and Vps25 essential for eMi. (I) Western blot analysis of Arouser protein level in fed and 4 h starved larvae overexpressing HA-Hsc70-4WT or HA-Hsc70-43KA in the fat body. (J, K, L, M) Representative pictures (J, K, L, scale bars: 10 μm) and quantification (M) of PA-puncta in 24 h starved wild-type (wt) and aru mutant larvae. Bar charts show means ± s.d. Statistical significance was determined using one-way ANOVA and based on at least three independent biological replicates, *P < 0.05.

