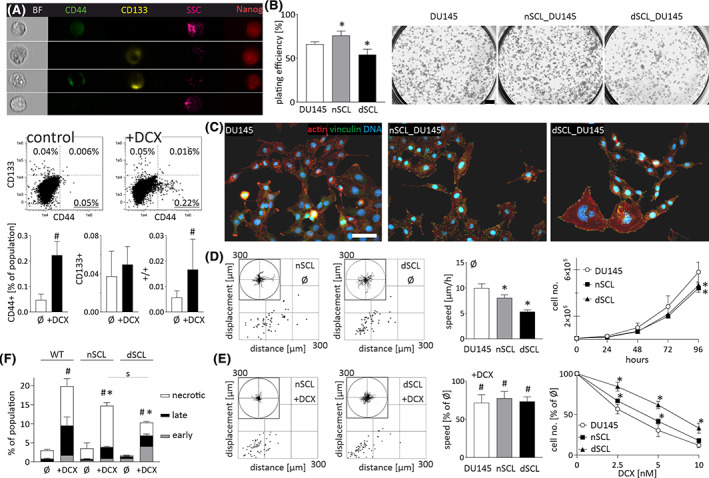
FIGURE 1.

Docetaxel (DCX)‐resistance and differentiation potential of DU145 stem cell‐like (SCL) CD44+ cells. A, Abundance of CD133+/CD44+ SCL cells in DU145_DCX20 and DU145_DCX50 populations (calculated as % of total cell number) in the absence/presence of DCX (10 nM). The values in compensated dot‐plots represent relative SCL fractions (N = 50 000). B, Clonogenic activity of CD44+ SCL progenies (500/cm2) estimated with CBB R250 staining. Scale bar = 2 mm. C, nSCL_DU145 and dcxSCL_DU145 cells were cultivated for 2‐6 passages and their morphology/actin cytoskeleton architecture was estimated with fluorescence microscopy. Scale bar = 50 μm. D‐F, The effect of 10 nM DCX on the motility (D, E; left), proliferation (D, E; right) and apoptosis (F) of nSCL_DU145 and dcxSCL_DU145 cells estimated with time‐lapse videomicroscopy (after 6 hours), Coulter counter (after 48 hours), and FACS (after 72 hours), respectively. Cell trajectories are depicted in circular diagrams (axis scale in μm) drawn with the initial point of each trajectory placed at the origin of the plot (registered for 6 hours; N > 50). Dot‐plots and column charts show movement parameters at the single cell and population level, respectively (plotted as % of control). Apoptosis was assessed in 50 000 AnnexinV/PI‐stained cells. The statistical significance of the differences was tested with t‐Student test (A, B, F and proliferation in D, E; #P ≤ .05 vs untreated control; *P ≤ .05 vs wild‐type [WT] lineage; s P ≤ .05 vs indicated bars) or by one‐way ANOVA followed by post hoc Tukey's HSD (D, E motility; *P ≤ .05 vs WT lineage). All results are representative of a least three independent experiments (N ≥ 3). Note the drug resistance of CD44+ SCL cells and their ability to differentiate into DCX‐resistant “bulk” lineages
