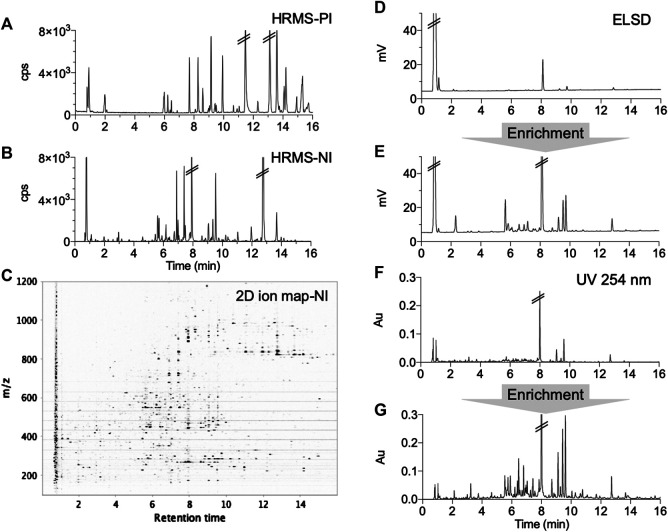
FIGURE 2.
UHPLC metabolite profiling of the formula with different detections before and after enrichment: (A,B) complementary positive (PI) and negative (NI) ionization chromatograms, (C) 2D ion map presenting all ions detected in NI, (D,E) ELSD chromatograms before and after SPE enrichment showing the unretained polar metabolites (mainly saccharides), (F,G) UV chromatograms (254 nm) before and after enrichment.

