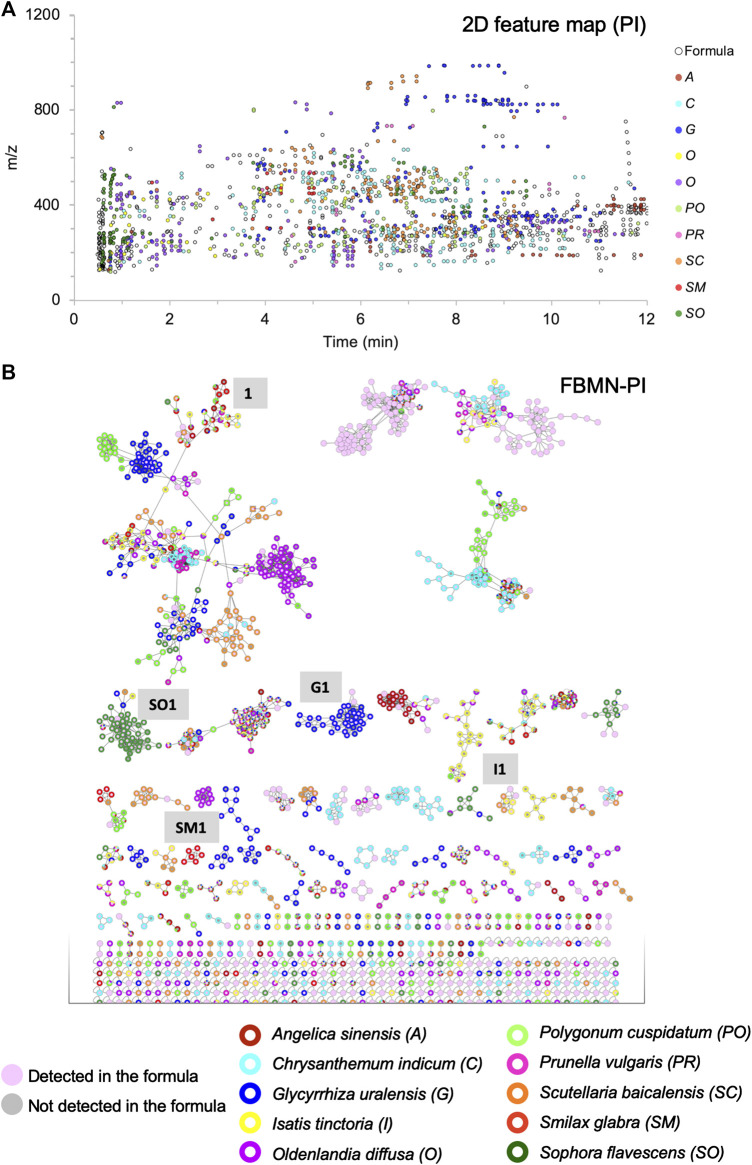
FIGURE 3.
Visualization of the contribution of the 10 herbs to the formula, in which each herb is represented by a different color: (A) 2D feature map in PI: each black circle represents a feature detected in the formula, the size of the circles is fixed and equal for all features. The inner color of the circle indicates that the feature is specifically detected in one of the 10 herbs (90% specificity threshold). (B) FBMN in PI for the organization of the MS/MS spectra of all features presented in (A), with the same color coding and fixed node size.

