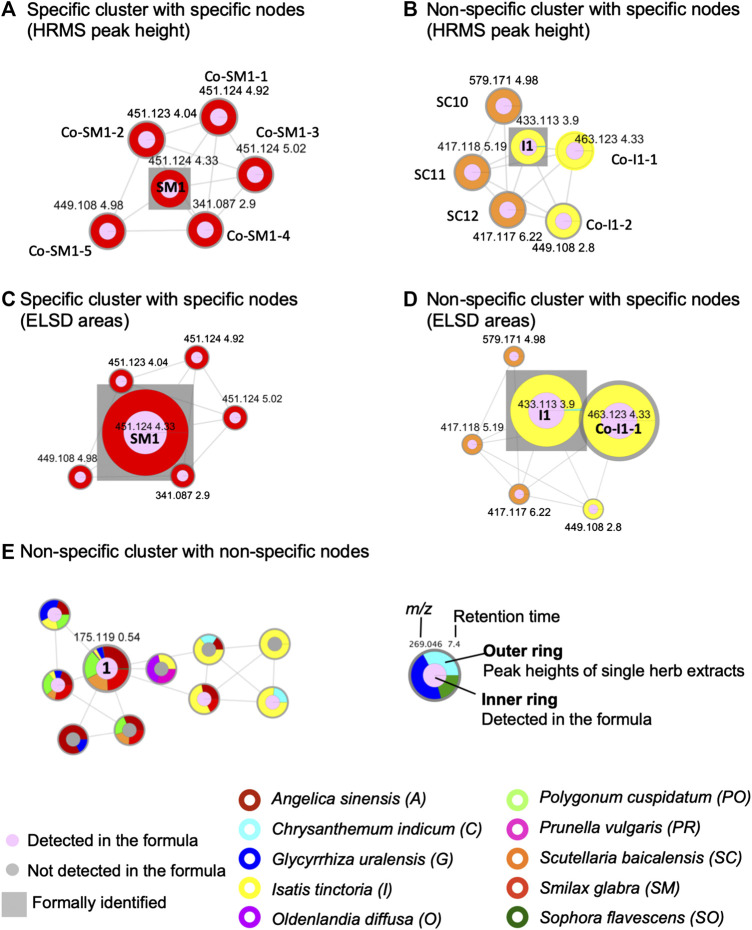
FIGURE 4.
Selected examples of cluster and node specificity in the FBMN-PI: (A) specific cluster for S. glabra (100%) exhibiting only specific nodes (the size node is proportional to the HRMS height of the peak), (B) non-specific cluster (50% S. baicalensis and 50% I. tinctoria), with nodes each specific to one single herb (specific components of each herb sharing common structural type for both herbs) (the size node is proportional to the HRMS height of the peak), (C) the same cluster as in (A) with the node sizes proportional to the ELSD areas, (D) the same cluster as in (B) with the node sizes proportional to the ELSD areas, (E) non-specific cluster common to several herbs with a node annotated as an ubiquitous component, arginine (1) (the node size is proportional to the HRMS height of the peak). For arginine (1), the colors shows the following specificity percentage: A. sinensis 28%, G. uralensis 5%, I. tinctoria 3%, O. diffusa 1%, P. cuspidatum 21%, S. baicalensis 18%, S. glabra 24%, S. flavescens 1%) (the size node is proportional to the HRMS height of the peak). Each herb is represented by a different color on the external ring. On the nodes, the numbers indicate feature m/z and retention time. The square is used to label formally identified components. Codes such as Co-Sm1-2 or SC10 referred to annotations, see Supplementary Tables S5, S9, S10.

