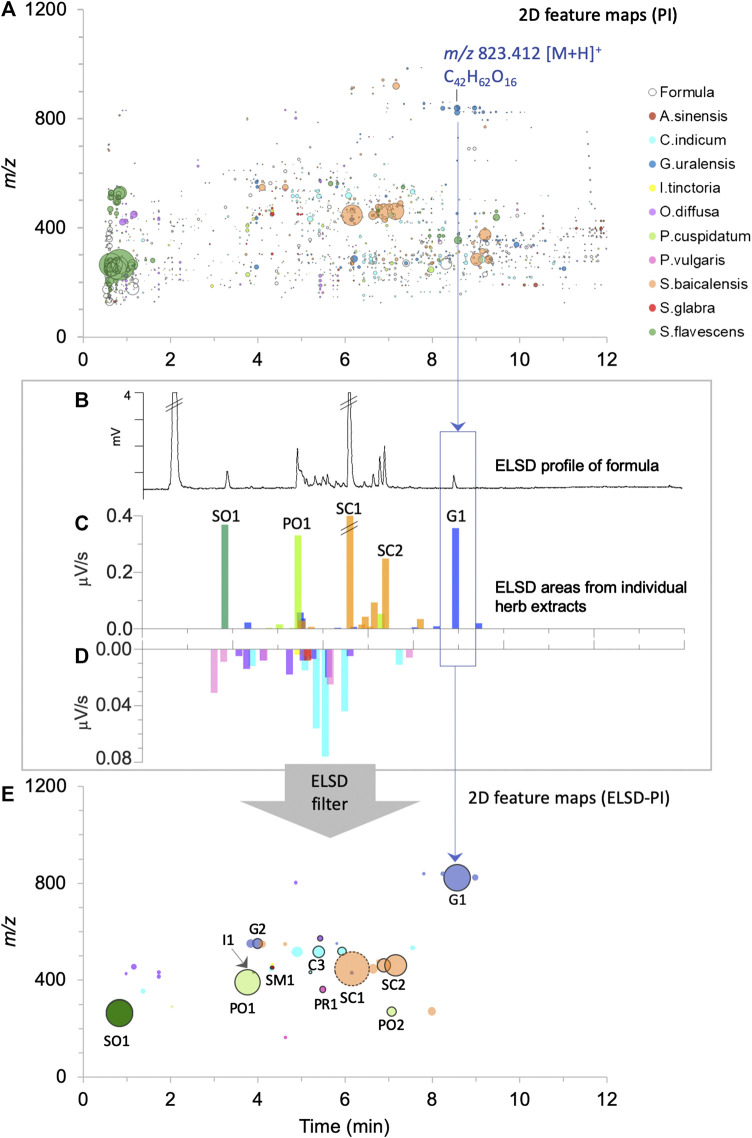
FIGURE 5.
Visualization of the contribution of the 10 herbs to the formula normalized by ELSD filtering to consider semi-quantitative relationship between components. Each herb is represented by a different color as in Figures 3, 4: (A) 2D feature map in PI: the size of the circles is proportional to the feature height intensity in the formula, only features detected in the formula are represented. The inner coloration of the circles indicates that the feature is specifically detected in one of the 10 herbs (90% specific threshold), (B) ELSD profile of the formula, (C,D) bar plots proportional to the chromatogram retention time dimension with superimposed ELSD areas of the individual herb extracts, presented in two scales, from 0 to 0.4 μV/s in (C) and from 0 to 0.08 μV/s in (D). (E) 2D feature map (PI) presenting the features to which ELSD peaks were assigned. The size of the dots is proportional to ELSD areas, with the exception of the dot with a dashed circle (SC1), where half of the area value is shown to improve visualization (very major component). The dots with a black outer circle represented components that have been formally identified.

