FIGURE 7.
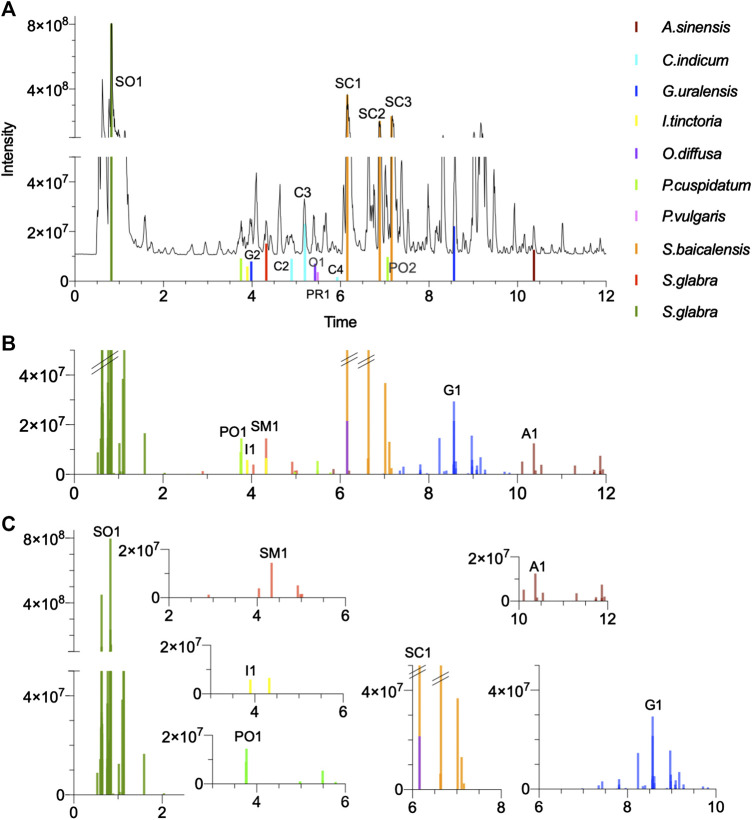
Multi-component signatures extracted from the FBMN (Figures 3B, 6) and represented in the form of bar chromatograms presenting the feature height intensity as a function of retention time in PI: (A) metabolite profile of the formula showing all formally identified components, (B) bar chromatograms showing seven multi-component signatures. (C) multicomponent signatures for S. glabra and its marker astilbin (SM1), I. tinctoria and isovitexin (I1), P. cuspidatum and E-piceid (PO1), A. sinensis and ligustilide (A1), G. uralensis and uralsaponin A (G1), S. flavescens and oxymatrine (SO1) and S. baicalensis and baicalin (SC1). All X axes represent time dimension, all Y axes feature height intensity. See Supplementary Tables S2–S11 for annotations.

