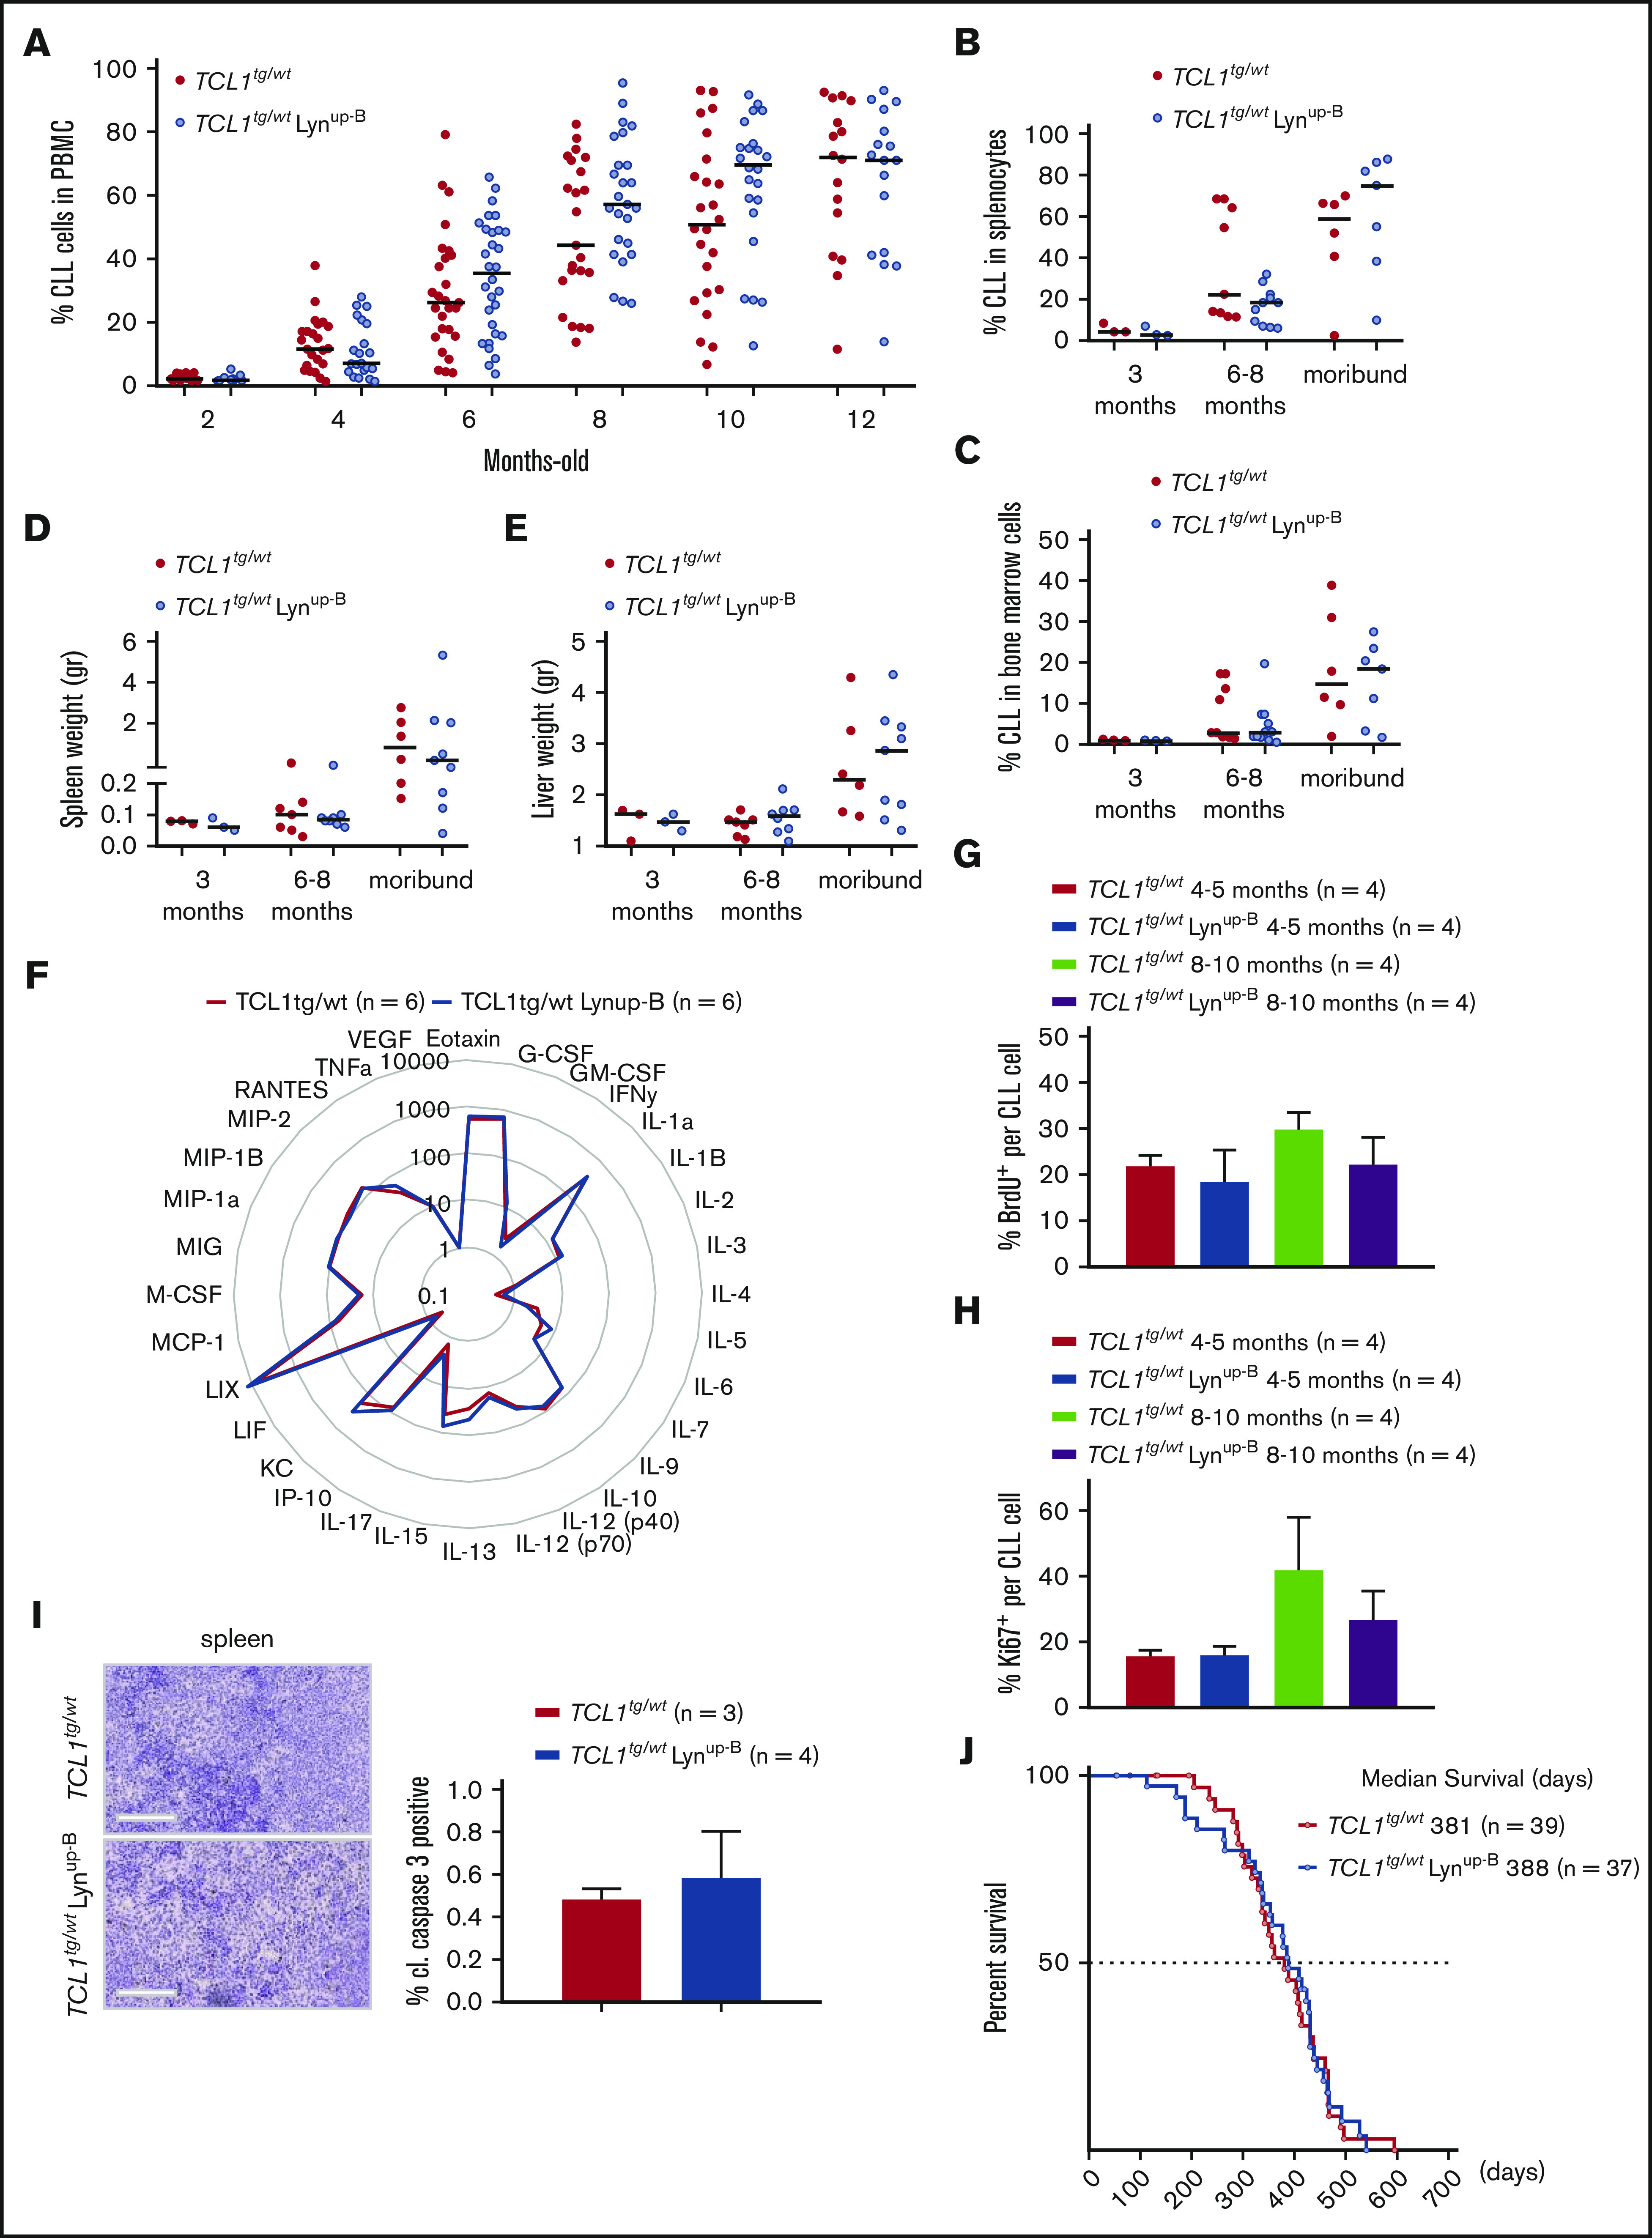
Figure 3.

TCL1tg/wtLynup-Bmice show no clear difference in CLL burden compared with TCL1tg/wtmice. (A) Flow cytometric analysis of CD19+ CD5+ CLL cells in the peripheral blood of TCL1tg/wt and TCL1tg/wt Lynup-B mice over 1 year. (B) Flow cytometric analysis of CLL cells in spleens of age-matched and moribund mice. (C) Flow cytometric analysis of CLL cells in bone marrow samples of age-matched and moribund mice. (D) Spleen weights of age-matched and moribund TCL1tg/wt and TCL1tg/wt Lynup-B mice. (E) Liver weights of age-matched and moribund TCL1tg/wt and TCL1tg/wt Lynup-B mice. (F) Cytokine profile in sera of 6 TCL1tg/wt and TCL1tg/wt Lynup-B mice. Data represent mean values (pg/mL). (G) Flow cytometric analysis of in vivo BrdU incorporation rate in splenic CLL cells of mice at 4 to 5 months and 8 to 10 months 16 hours after injection of BrdU. (H) Flow cytometric analysis of Ki67+ splenic CLL cells of young (4- to 5-month old) and old (8- to 10-month old) mice. (I) Representative immunohistochemical staining of cleaved caspase-3 (cl. casp. 3) from sections of spleens from TCL1tg/wt and TCL1tg/wt Lynup-B mice. Scale bars represent 100 µm. Quantification of cleaved caspase-3–positive cells represent means ± SEM of 3 TCL1tg/wt and 4 TCL1tg/wt Lynup-B mice. (J) Kaplan-Meier curves representing the overall survival of TCL1tg/wt and TCL1tg/wt Lynup-B mice from birth to moribund.
