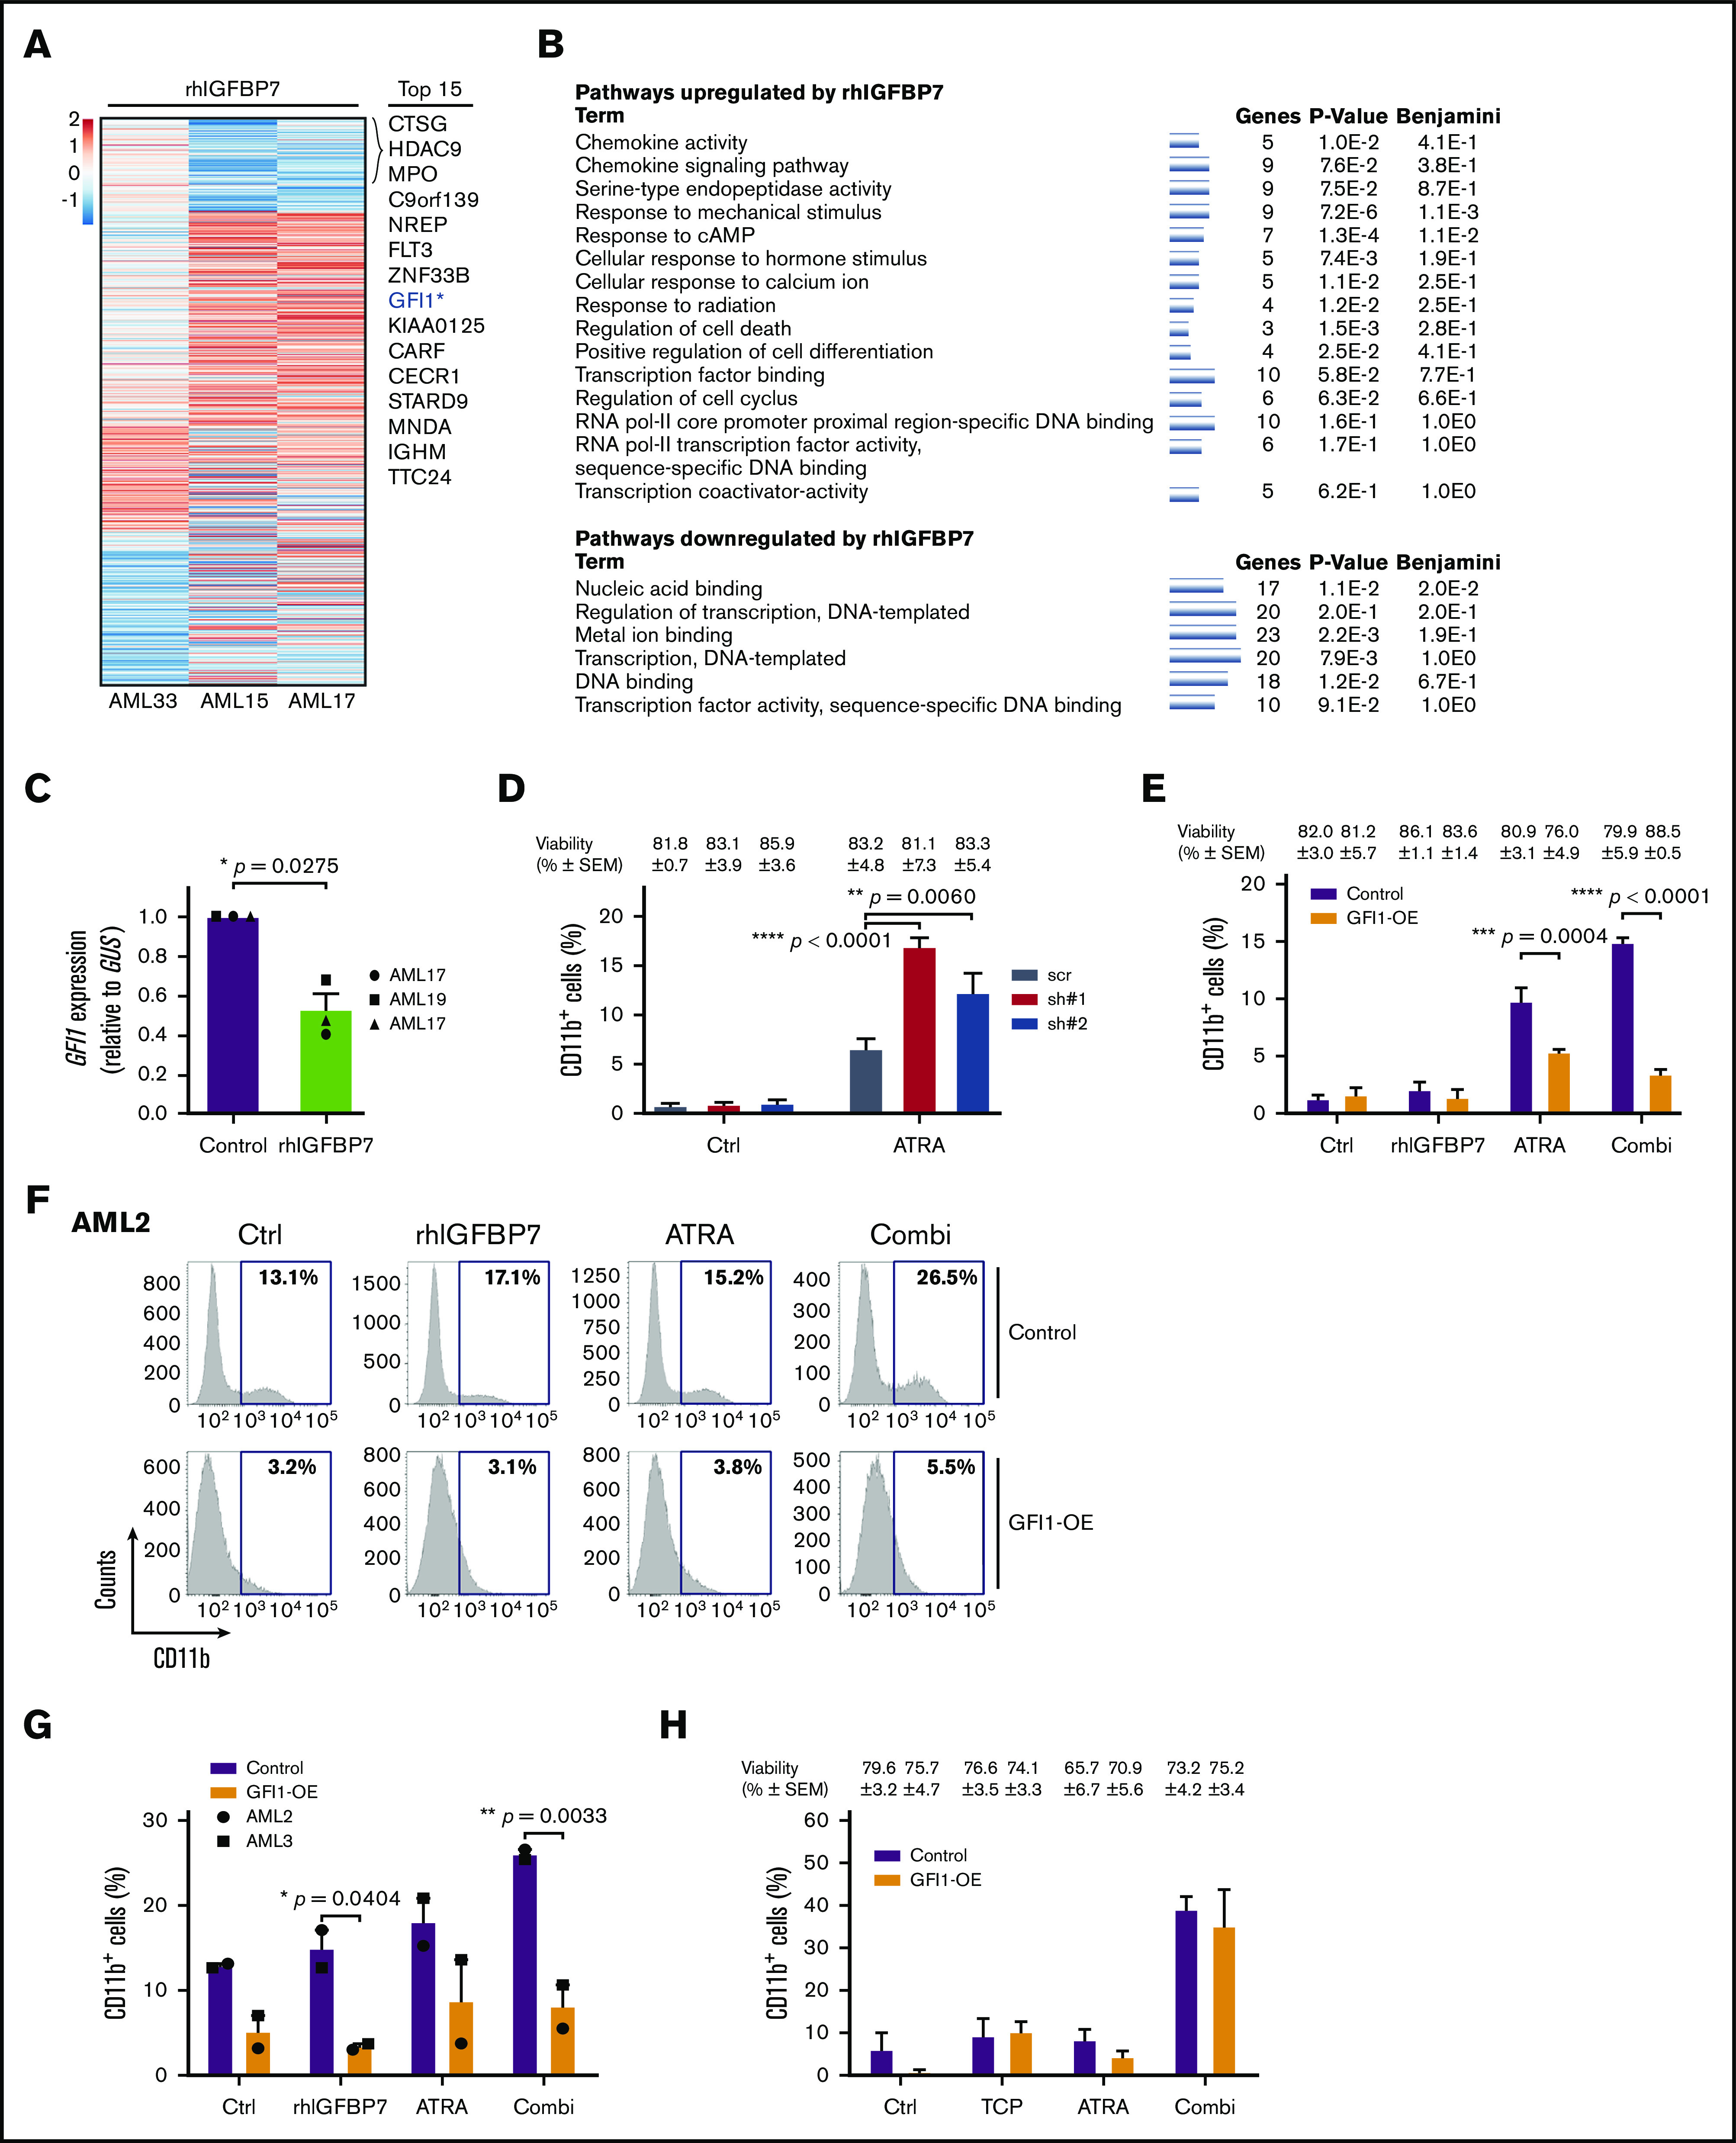
Figure 5.

rhIGFBP7 induces susceptibility to ATRA by reducing GFI1 expression. AML cells were stimulated with 100 µg/mL rhIGFBP7, 0.5 µM ATRA, 1.0 µM TCP, or the combination (Combi) for 4 days (HL60 cells) or 7 days (primary AML cells). Induction of differentiation (membrane CD11b expression) and cell viability were measured using flow cytometry and quantified relative to flow count beads. Data are representative of ≥3 independent experiments, plotted as mean ± SEM. Patient sample characteristics are summarized in supplemental Table 1. (A) Heat map of the top 111 differentially expressed genes in CD45dim cells from 3 primary AML samples after treatment with rhIGFBP7 for 48 hours. Genes were selected based on their log2-fold change (FC) in rhIGFBP7-stimulated samples compared with untreated controls (cutoff value = log2FC < −0.5 and > +0.5; P < .01). The top 15 downregulated genes are listed. *Position of GFI1. (B) Pathway analysis of the top upregulated and downregulated genes in response to rhIGFBP7 treatment for 48 hours. The minimum number of overrepresented genes was set to 3, and the Kyoto Encyclopedia of Genes and Genomes pathway and Gene Ontology process were used to perform functional pathway analysis using DAVID (v6.8). (C) GFI1 expression (in triplicate) in primary AML samples after treatment with rhIGFBP7, measured relative to GUS expression using qRT-PCR, and normalized against control sample. P values were determined using a paired Student t test. (D) HL60 cells were lentivirally transduced with GFI1-shRNAs (sh#1 and sh#2) or scrambled (scr) shRNA. The percentage of (Venus+)CD11b+ HL60 cells was measured after 4 days of ATRA treatment, and the percentage of viable cells (blue) for each condition is listed above the graph. P values were determined using 2-way ANOVA with a post hoc Tukey’s multiple-comparison test. (E-H) AML cells were lentivirally transduced with control-YFP (Control) or GFI1-YFP (GFI1-OE)–expressing vectors. (E) Percentage of CD11b+ cells after treatment of HL60 cells. The percentage of viable cells (blue) for each condition is listed above the graph. Example of flow cytometric analysis of AML2 (F) and percentage of membrane CD11b in the transduced (YFP+)CD45dim cell population of 2 primary AML samples, measured 14 days posttransduction (G). (H) Percentage of CD11b+ cells after treatment of HL60 cells with TCP, ATRA, or the combination (Combi). The percentage of viable cells (blue) for each condition is listed above the graph. *P < .05, **P < .01, ***P < .001, ****P < .0001, 2-way ANOVA with post hoc Bonferroni multiple-comparison test, unless stated otherwise.
