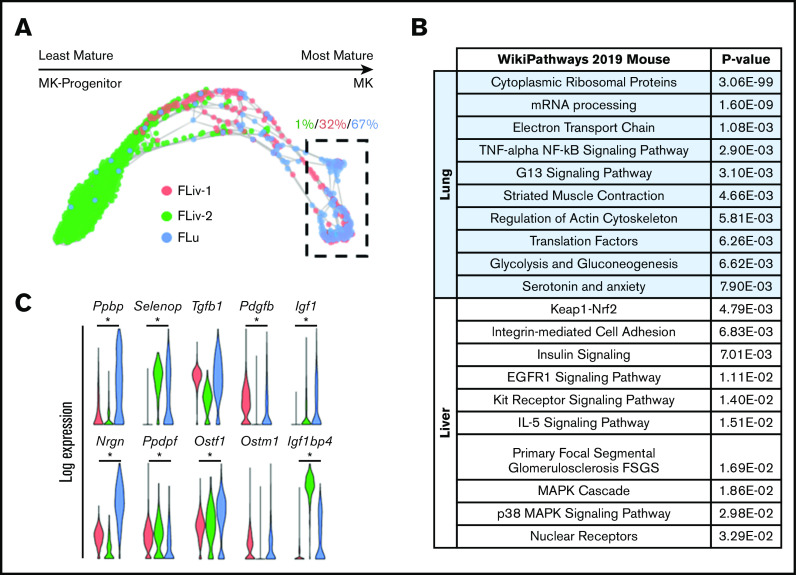
Figure 3.
Fetal lung MKs display transcriptional priming for platelet and cytokine production. (A) SPRING plot of fetal MK clusters. Directionality of maturation progresses from left to right and was determined based on key markers, as described in supplemental Figure 4. Percentages indicate which fraction of the outlined cells is represented by each respective cluster. (B) Gene set enrichment analysis of the corresponding clusters that are outlined in a dashed box in panel A. (C) Violin plots comparing the expression of various cytokines and growth factors across all fetal MK clusters. *P < .0001.

