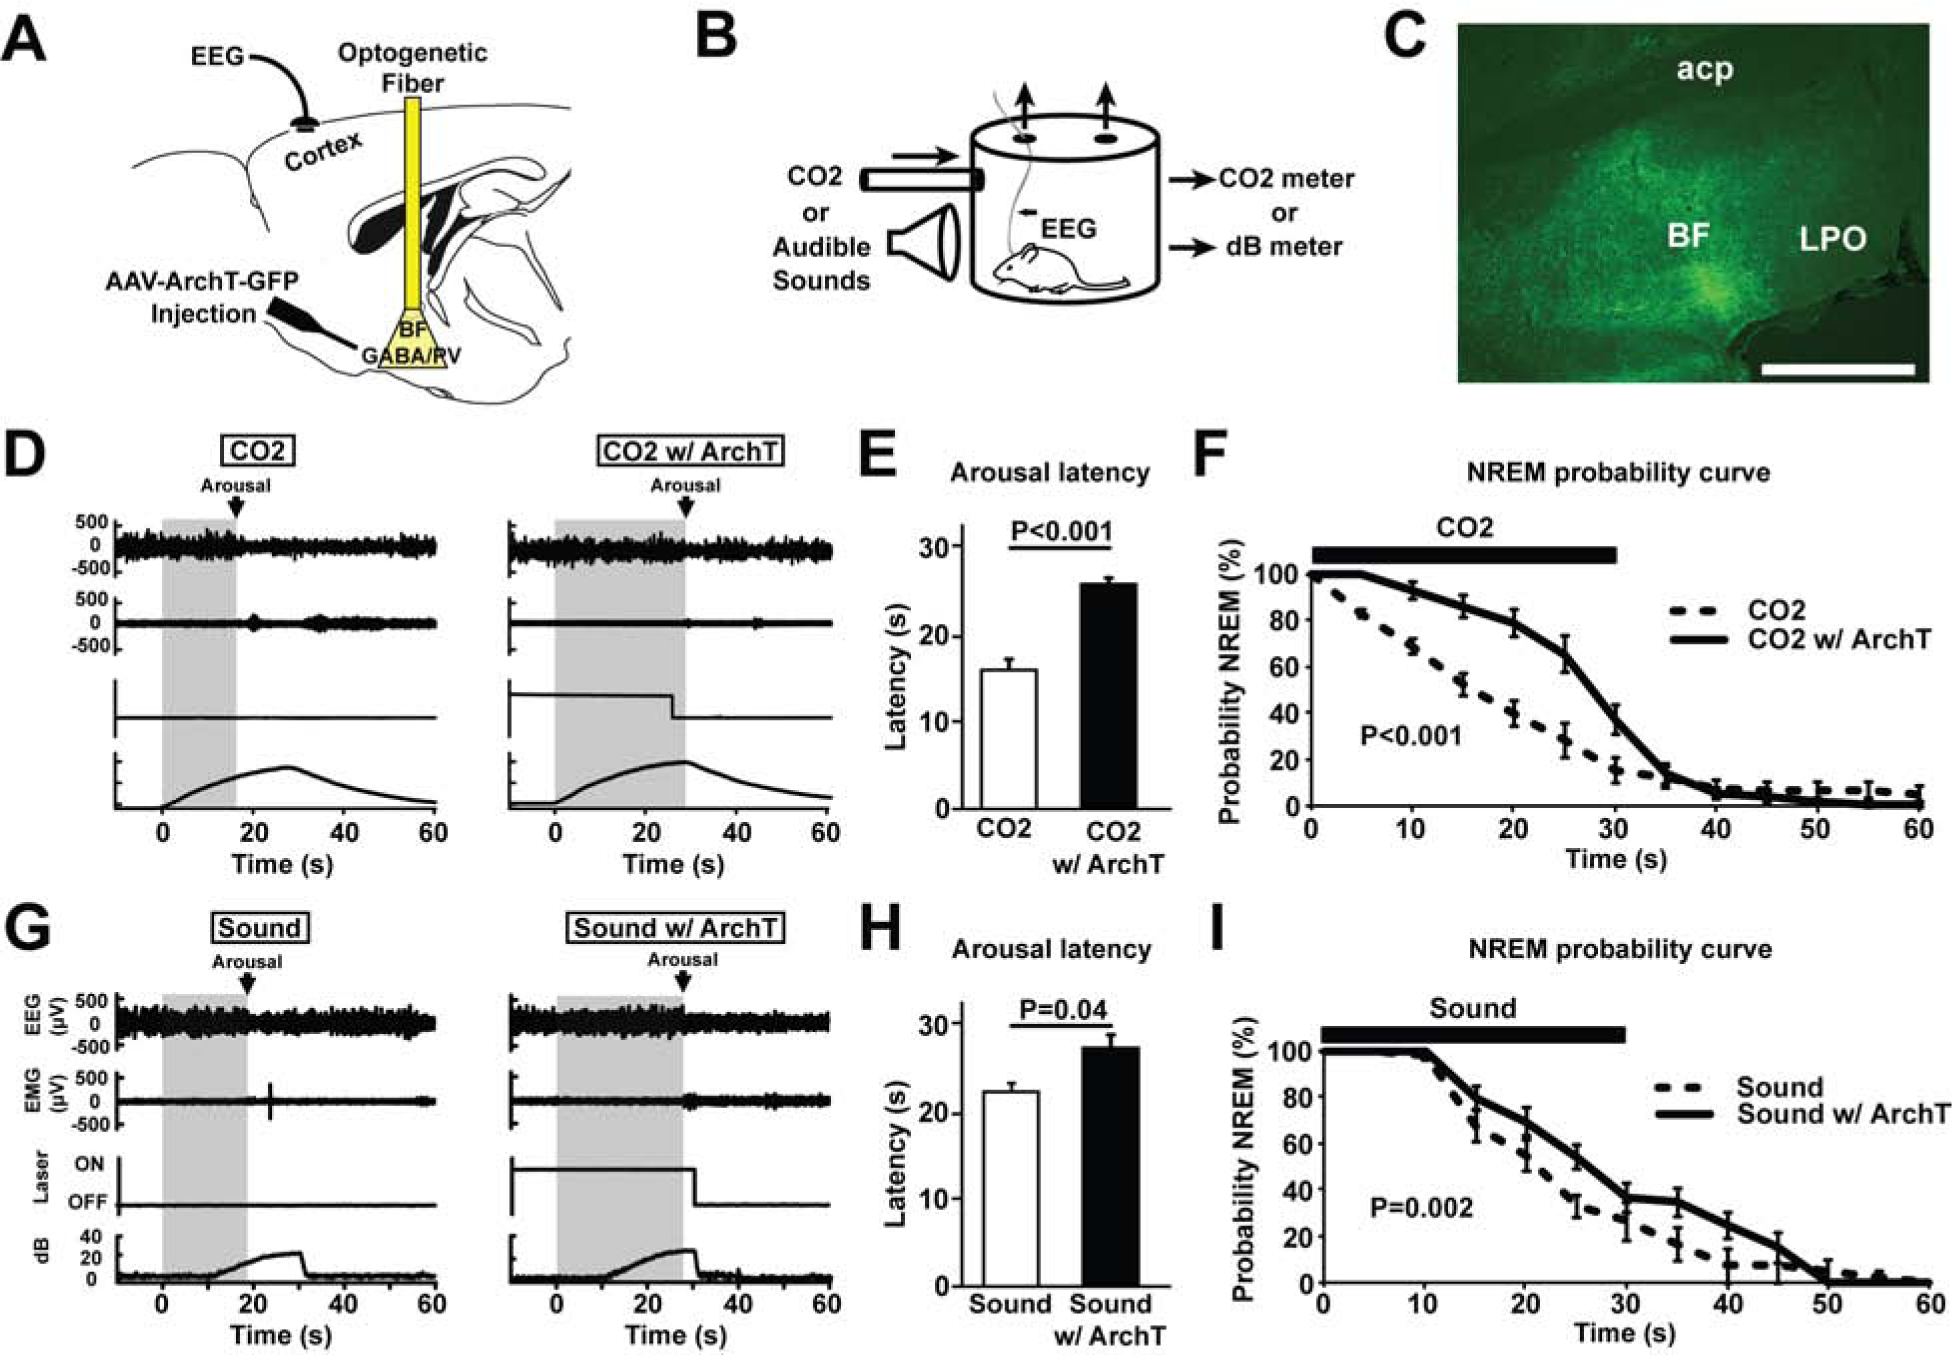
Figure 3. Bilateral optogenetic inhibition of BF-PV neurons increases the latency to arousal in response to hypercarbia (excessive CO2) or auditory stimuli.

(A) Adeno-associated viral vectors with Cre-dependent expression of ArchT-green fluorescent proteins (AAV-Flex-ArchT-GFP) were bilaterally injected into the BF of PV-cre mice. Following transduction, green (532 nm) laser light was applied bilaterally to excite ArchT and inhibit BF-PV neurons.
(B) Mice were placed in a recording chamber where they were briefly exposed to increased CO2 or sound levels for 30 s every 5 min.
(C) AAV-ArchT-GFP injections transduced neurons and fibers throughout large areas of BF. One representative case is depicted here. Scale bar = 1 mm. A summary of all cases in provided in Figure S1.
(D) Representative primary traces of EEG, EMG, laser on/off, and ambient CO2 percentage levels. Left: The grey shaded area shows arousal latency from the start of the stimulus to the point at which the animal awakens, determined as the onset of desynchronized EEG lasting > 2 seconds, in response to increased CO2. Right: In the same mouse, the latency to arousal in response to increased CO2 was prolonged when BF-PV neurons were inhibited (CO2 w/ ArchT), as indicated by the wider grey shaded area.
(E) Mean latencies to arouse from CO2 (N=7) significantly differed, comparing CO2 vs. CO2 w/ArchT (BF-PV inhibition).
(F) NREM probability curve plots indicate that the probability that animals stay in NREM sleep during CO2 infusion is significantly increased due to BF-PV optogenetic inhibition (CO2 w/ArchT), compared to the laser off condition (CO2) or laser on, fluorophore-only controls (not shown, see main text).
(G) Representative primary traces of EEG, EMG, laser on/off, and ambient sounds levels. Left: The grey shaded area shows arousal latency from the start of the stimulus to the point at which the animal awakens, determined as the onset of desynchronized EEG lasting > 2 seconds, in response to increased background sound levels. Right: In the same mouse, the latency to arousal in response to increased sound was prolonged when BF-PV neurons were inhibited (CO2 w/ ArchT), as indicated by the wider grey shaded area. Note: The first 10 secs of sound stimuli were not detectable by the microphone above the background noise.
(H) Mean latencies to arouse in response to increased sound (N=7) significantly differed, comparing sound vs. sound w/ ArchT (BF-PV inhibition).
(I) NREM probability curve plots indicate that the probability that animals stay in NREM sleep during increased sound is significantly increased due to BF-PV optogenetic inhibition (sound w/ArchT), compared to the Laser off condition (sound) or Laser on, fluorophore-only controls (not shown, see main text)
