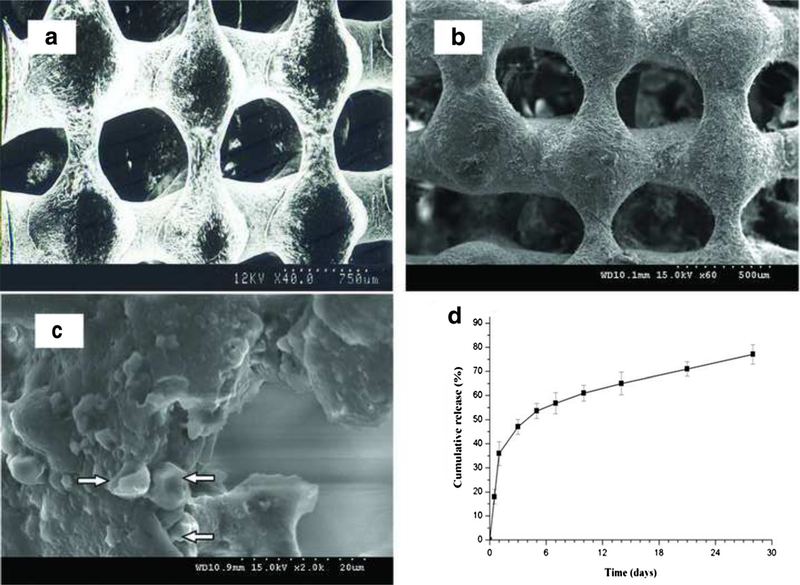
Fig. 1.
Scanning electron microscopic images. a. the empty PLGA scaffold. b. the empty PLGA-gelatin scaffold. c. Microspheres in the empty PLGA-gelatin scaffold, note: the arrows point to MS. d. Release profiles of TGF-β1 from the TGF-β1-immobilized scaffold. Data are expressed as mean±SD (n=5). The statistical evaluation of the data is detailed in the text

