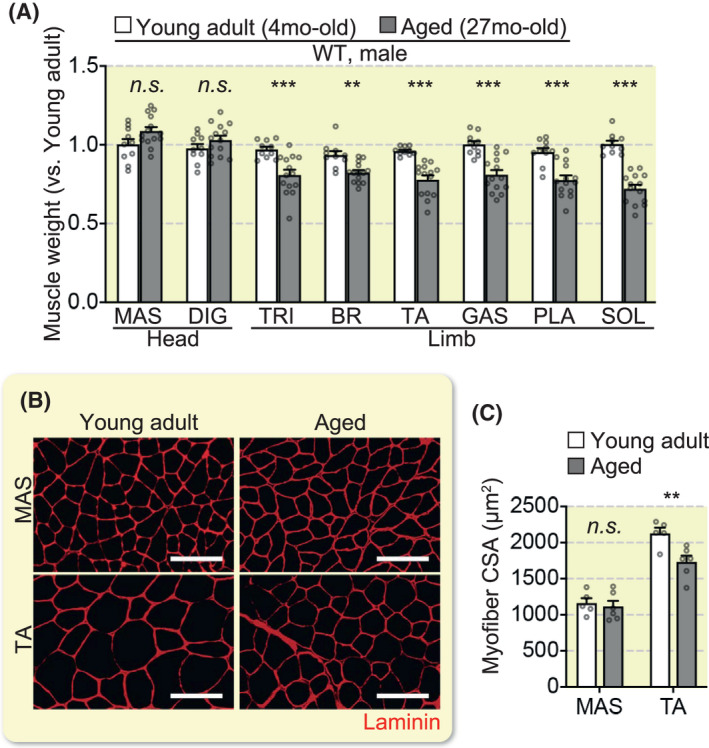
FIGURE 4.

Impact of ageing on head and limb muscles. (A) Muscle weight ratio (young adult; n = 10 mice, aged; n = 13 mice). (B) Representative immunohistochemical images of MAS and TA tissue sections stained for laminin. (C) Mean myofiber CSA (young adult; n = 5 mice, aged; n = 6 mice). Scale bars, 100 µm. All error bars show the SEM. **P < .01, ***P < .001. MAS, masseter; DIG; TRI, triceps brachii; BR, brachioradialis; TA, tibialis anterior; GAS, gastrocnemius; PLA, plantaris; SOL, soleus
