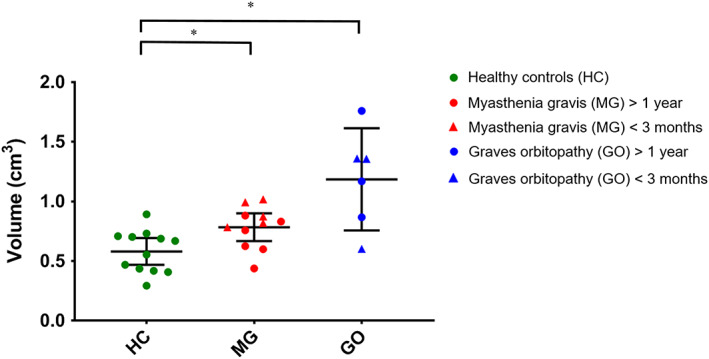
FIGURE 4.

Mean muscle volumes of the four recti muscles per subject. Data are shown as mean and standard deviation for healthy controls (HC; green), myasthenia gravis (MG) (red) and Graves' orbitopathy (GO) patients (blue). The mean volume was 0.6 ± 0.2 cm3 in HC, 0.8 ± 0.2 cm3 in MG patients and 1.2 ± 0.4 cm3 in GO patients. The MG and GO patients had significantly higher muscle volume compared with muscle controls (P = .007 and P < .001, respectively). Statistical significance is indicated by asterisks
