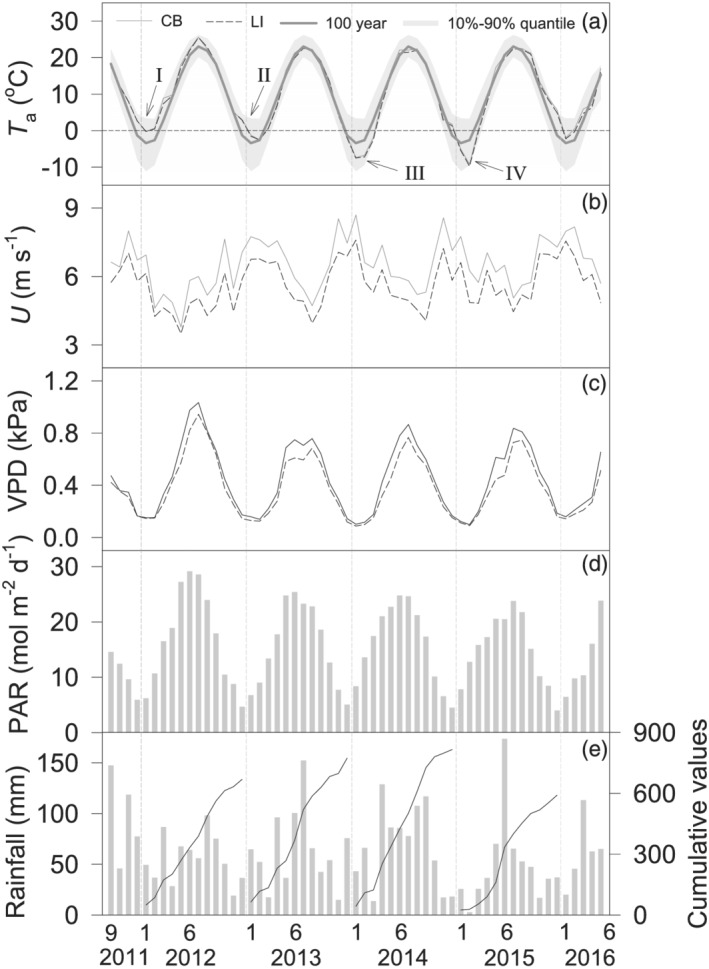
Figure 2.

Monthly mean (a) air temperature (T a), (b) wind speed (U), (c) vapor pressure deficit (VPD), (d) photosynthetically active radiation (PAR), and total and cumulative (e) rainfall measured ~15 m above the water surface at the CB and LI sites over Lake Erie from September 2011 to May 2016. Long‐term (1893–2015) average (gray lines) and its 90% quantile intervals (gray shaded areas) are presented in (a).
