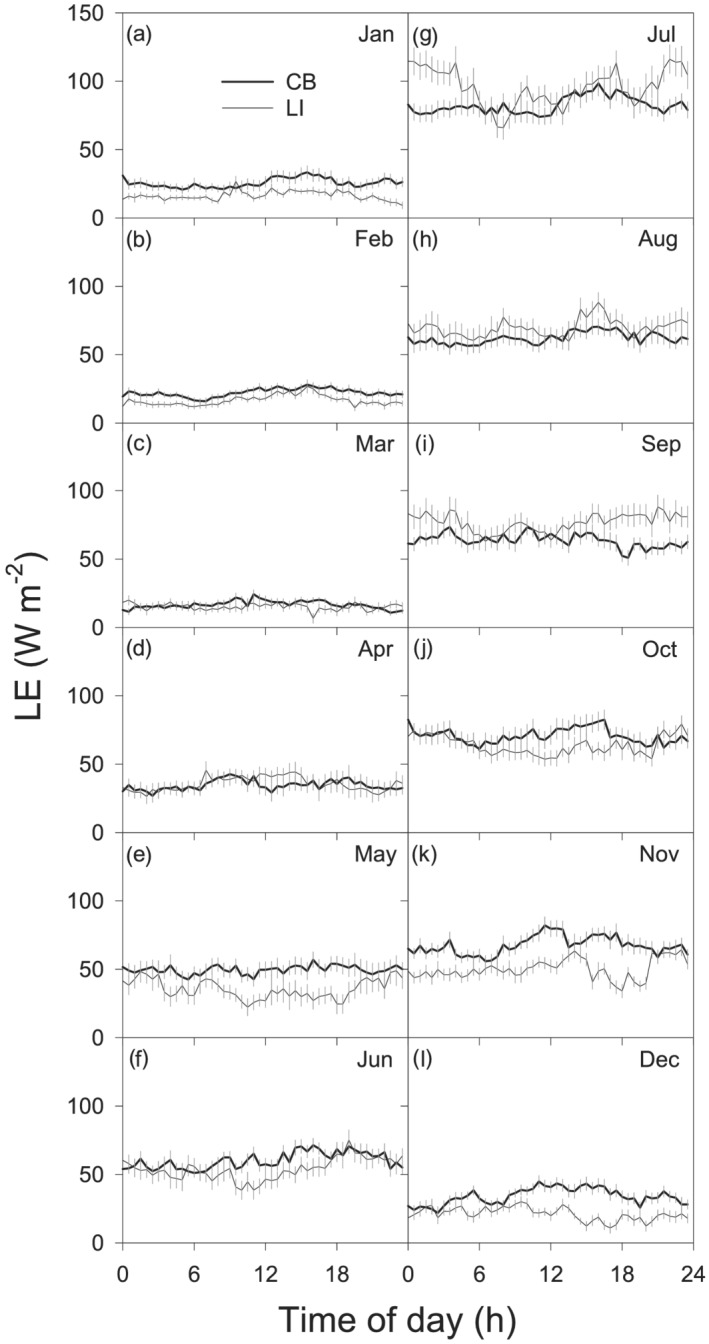
Figure 3.

Monthly average diurnal mean latent heat flux (LE) at the CB and LI sites in western Lake Erie. Data covered the entire measurement period. Charts a‐l show results from January–December, respectively. Data are presented in local standard time (UTC‐5).
