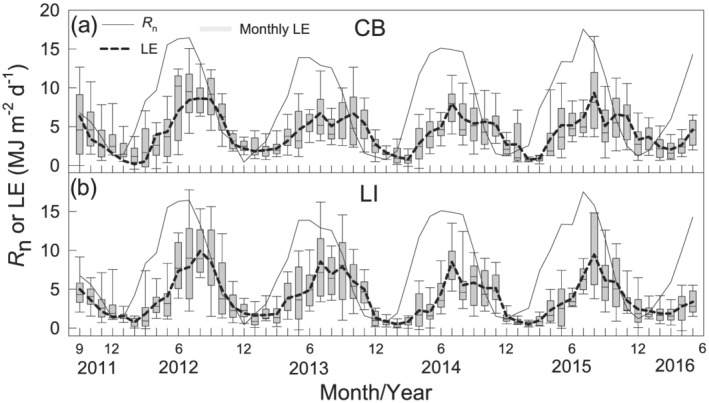
Figure 4.

Monthly net radiation (R n) and latent heat flux (LE) at the two Lake Erie sites from 2011 through 2016. The boxplots show the distribution (i.e., 25th, 50th, and 75th percentiles) of daily LE for each month. The whiskers indicate the 1.5 times interquartile range (25th to 75th percentile) plus the 75th percentile or minus the 25th percentile.
