Figure 5.

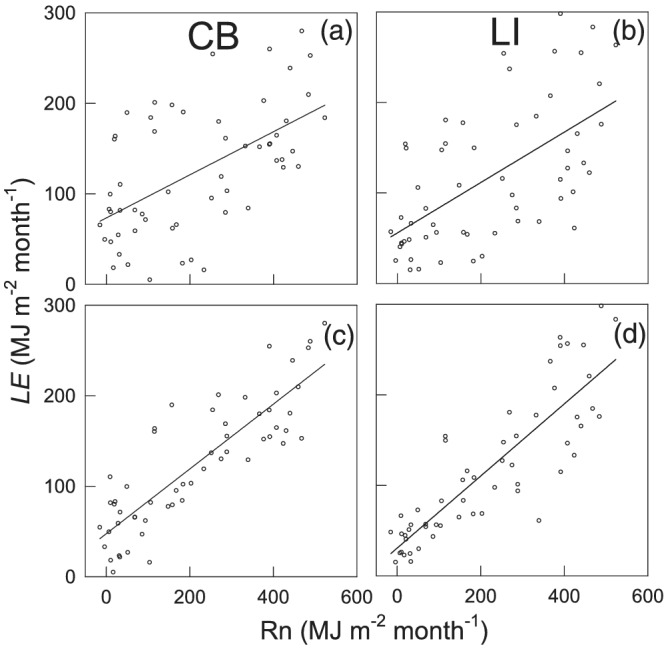
The relationships between the monthly latent heat flux (LE) and net radiation (R n) (a and b) at the CB and LI sites. Charts c and d show results using R n 2 months prior to the LE measurements. The lines represent the linear regressions.

The relationships between the monthly latent heat flux (LE) and net radiation (R n) (a and b) at the CB and LI sites. Charts c and d show results using R n 2 months prior to the LE measurements. The lines represent the linear regressions.