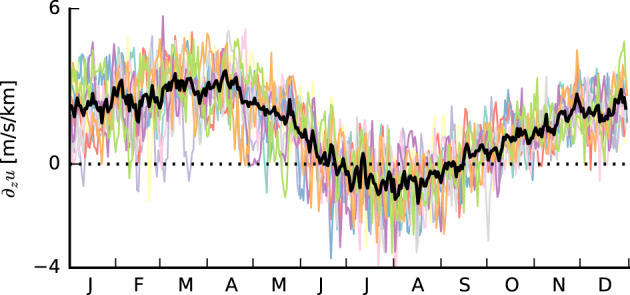
Figure 2.

Time series of the amount of zonal shear between 1 and 3 km for the years 2008 to 2017 averaged over the area from 9° to 19°N and from 50° to 59°W (colored lines). The black line is the average over all 10 years. The dotted horizontal line indicates 0 m/(s km). Data are from the ERA5 reanalysis.
