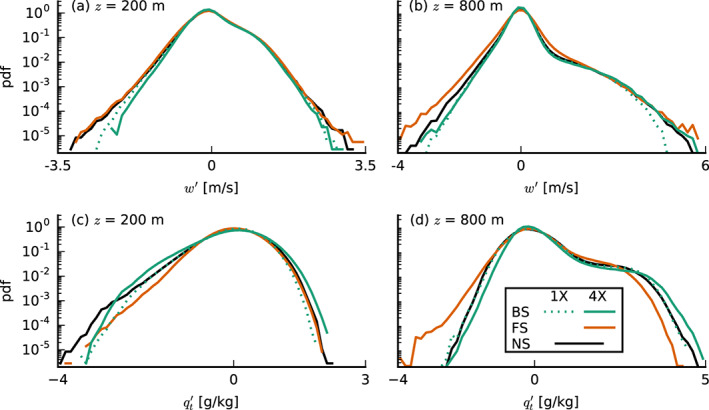
Figure 10.

Probability density functions of the vertical velocity w (top) and the total water specific humidity deviations (bottom) at constant heights of (left) m and (right) m (averaged from 30 to 36 hr of the simulations with prescribed surface fluxes).
