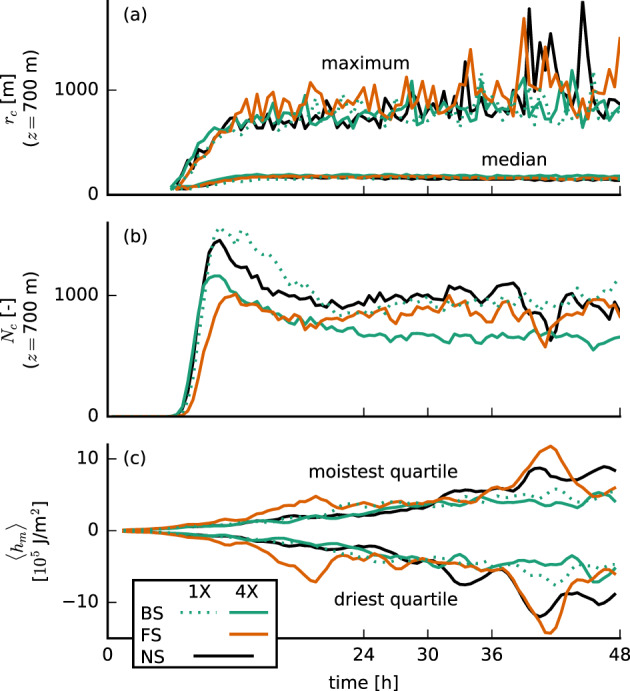
Figure 11.

Time series of (a) the median and maximum cloud radius rc at m, (b) the number of clouds Nc at that height, and (c) the vertically integrated moist static energy anomalies ⟨hm⟩ in the moistest and the driest quartiles of 12.6 × 12.6 km2 blocks for the simulations with prescribed surface fluxes.
