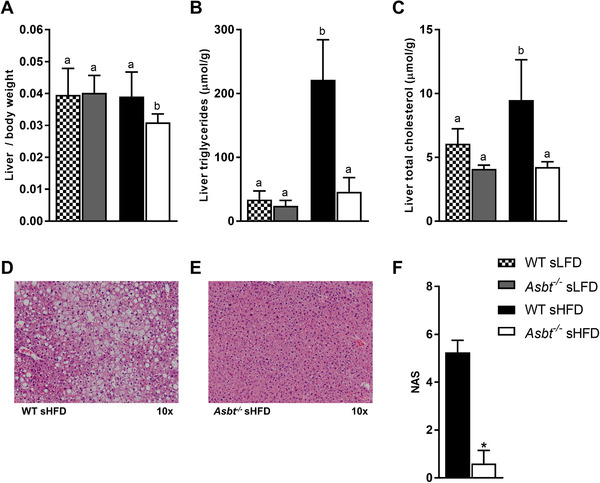
Figure 3.

Non‐alcoholic fatty liver disease (NAFLD) in Asbt−/− and WT mice fed a sHFD. A) Liver weight to body weight ratio; B) hepatic TG and C) hepatic total cholesterol in mice fed the sLFD and sHFD, n = 8 to 10; D) H&E staining of WT mouse liver after sHFD feeding, E) H&E staining of Asbt−/− mouse liver after sHFD feeding, representative samples; F) NAFLD activity score (NAS) based on histology, n = 4 to 5. Different lowercase letters indicate statistically significant differences (p < 0.05) between four groups. Between two groups statistical difference is indicated as *p < 0.05, **p < 0.01, ***p < 0.001.
