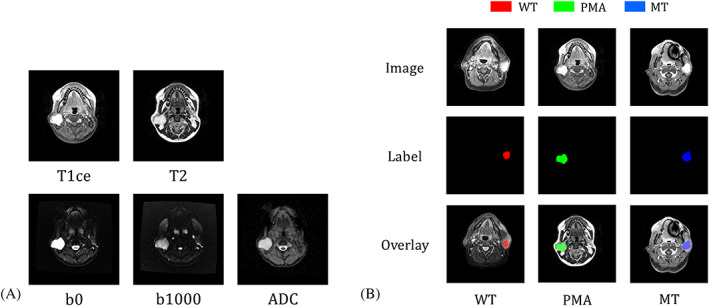
FIGURE 1.

A, An example stack consisting of five types of MRI image. From left to right and top to bottom, they are contrast‐enhanced T 1, T 2, b 0, b 1000, and ADC images. The ADC map was reconstructed from b 0 and b 1000 images. We had 2726 stacks from 85 patients. B, Manually drawn regions of interest of the three types of tumor: NT areas are indicated in black, WT in red, PMA in green, and MT in blue. In the stored file, we used numbers 0 to 3 for NT, WT, PMA, and MT pixels, respectively
