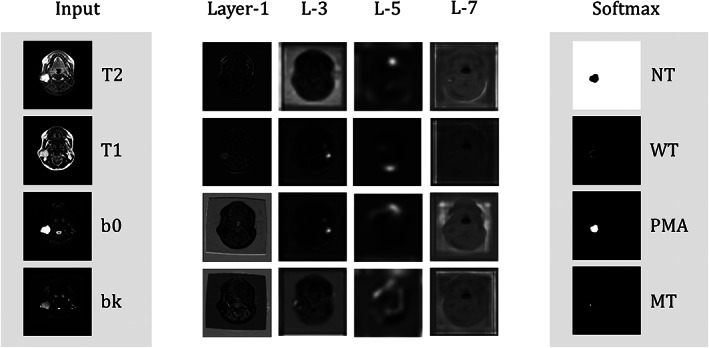
FIGURE 2.

Visualization of the output images of the intermediate and softmax layers of the sALL U‐Net model. Layers 1 to 5 are in the encoding path, and output images are down‐sampled with max‐pooling to reduce feature numbers. The pixel values of the output images of the softmax layer present the probability distribution (white for 1, black for 0) of four categories (ie NT, WT, PMA, and MT). As an example, the large region of white color in the upper‐right image (the NT image from softmax output) means that these white pixels likely belong to the NT category, except for the small dark region, likely belonging to a pleomorphic tumor (cf. the PMA image from softmax output)
