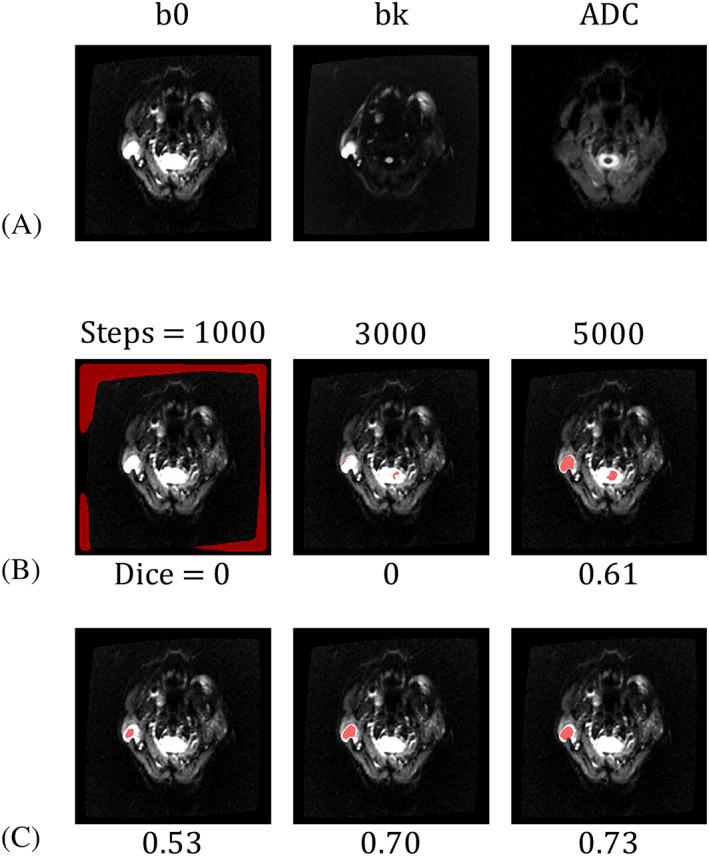
FIGURE 3.

Demonstration of the PGT segmentation of an image containing a WT on the right side. The input is an sDWI stack (A), and WT regions are predicted using models trained with Scheme 1 (B) and Scheme 2 (C). The WT regions are presented as red pixels overlaying the ADC images. After 1000, 3000, and 5000 training steps, the WT region became progressively more accurate. The number beneath each image is the Dice coefficient between the predicted and actual tumor regions. This example demonstrates the advantage of using transfer learning in Scheme 2
