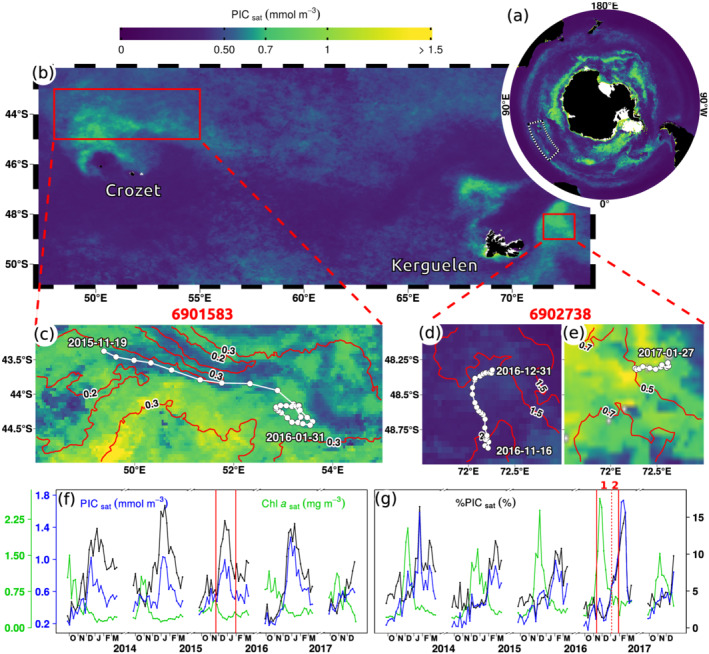
Figure 1.

Float trajectories and coccolithophore bloom occurrences. (a) Summer climatology of satellite [PIC] (2012–2018) showing the Great Calcite Belt and (b) high‐[PIC] patches in the study area. Red rectangles outline float sampling zones. Trajectories of floats 6901583 (c) and 6902738 during (d) the Period 1 of high [Chl‐a] and (e) the Period 2 of increasing [PIC]. Background maps are satellite [PIC] averaged over the duration of float operations. Red lines correspond to isolines of satellite [Chl‐a], and concurrent [Chl‐a] maps are displayed on Figure S8 in the supporting information. (f, g) Area‐averaged time series of [PIC], [Chl‐a] and %PIC for both sampling zones, i.e., (f) is the time series for the area shown in (c) and (g) for (d)/(e). Vertical red lines indicate periods sampled by floats, and the dashed line separates Periods 1 and 2.
