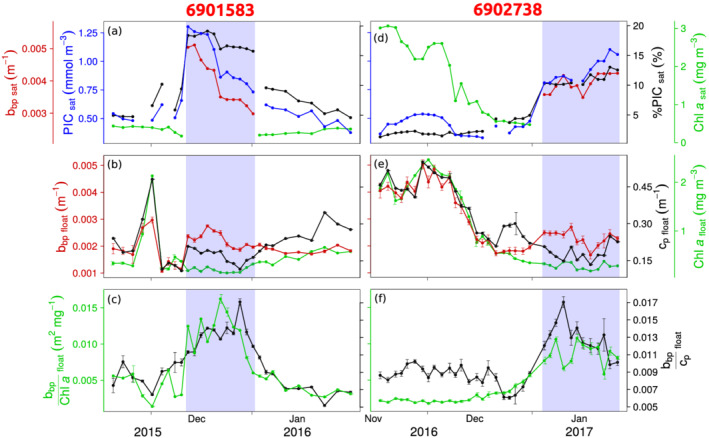
Figure 2.

Optical measurements and satellite products during the operation of float 6901583 (a–c) and 6902738 (d–f). Time series of (a,d) [PIC], %PIC, [Chl‐a], and b bp measured by satellites; (b,e) b bp, c p, and [Chl‐a] measured by floats; (c,f) b bp/[Chl‐a] and b bp/c p measured by floats. Blue bands delineate the coccolithophore bloom period identified by the satellite detection method. Error bars indicate the standard deviation from the surface average.
