
Figure 4.
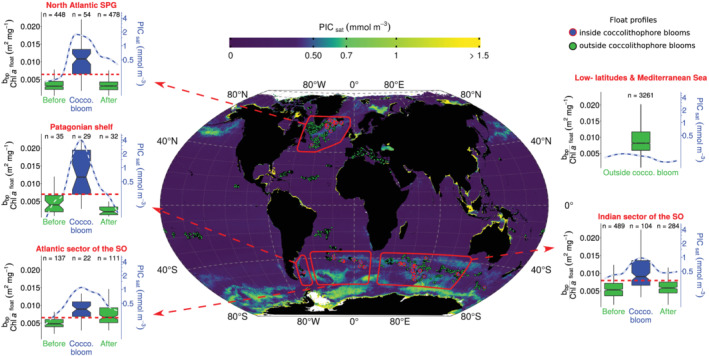
Detection of coccolithophore blooms with b bp/[Chl‐a] thresholds. The map reveals locations of profiles inside coccolithophore blooms detected by satellites. The background map is the summer climatology (2012–2018) of satellite [PIC] for each hemisphere. Boxplots show distributions of b bp/[Chl‐a] before, during, and after coccolithophore blooms in four temperate and subpolar regions identified with red polygons on the map, and in low‐latitudes (i.e., <35°) and Mediterranean Sea where no coccolithophore bloom was detected. Horizontal red dashed lines are the b bp/[Chl‐a] thresholds reported in Table 1. Blue lines are [PIC].