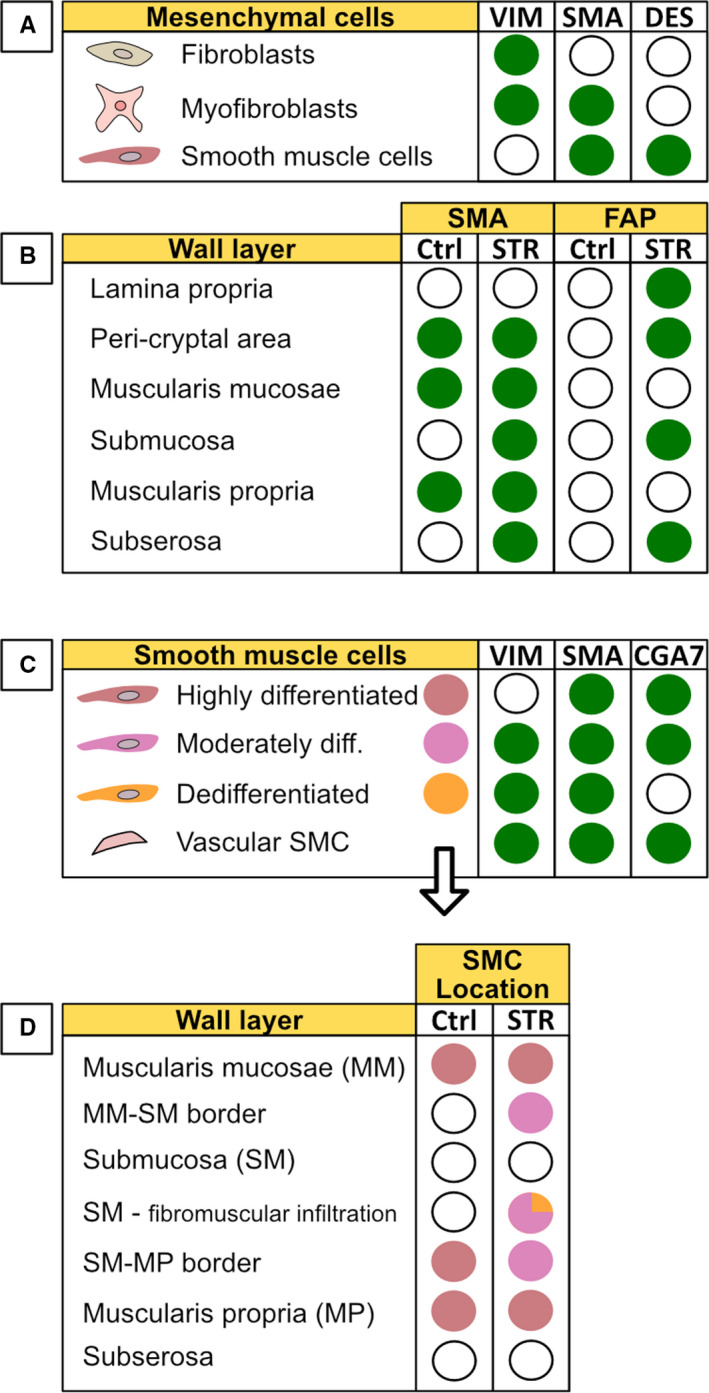
Figure 2.

An overview of mesenchymal cell markers and their distribution in tissue. A, Fibroblasts, myofibroblasts and smooth muscle cells are traditionally distinguished by their staining pattern of the three markers vimentin, α‐SMA and desmin. B, Distribution of the additional markers SMA and FAP in the intestinal walls of strictured (STR) tissue compared to normal (non‐strictured) control (Ctrl) tissue. C, Staining pattern for smooth muscle cells with different phenotypes (based on the degree of differentiation) as described in the text. D, The distribution of smooth muscle cells with different degrees of differentiation in the intestinal wall layers in non‐strictured tissue (Ctrl) and strictured tissue (STR). (A‐C): Green filled circle indicates presence of a marker (positive staining). C,D, Filled circles indicate the presence of a particular SMC phenotype based on the colour coding defined in C. VIM, Vimentin; SMA, alpha‐smooth muscle actin; DES, Desmin; FAP, Fibroblast activating protein; Ctrl, normal non‐strictured tissue; STR, strictured tissue; diff, differentiated; CGA7, antibody that selectively recognizes contractile smooth muscle cells expressing both alpha‐ and gamma‐actin; SMC, Smooth muscle cell. The staining patterns reflect data from numerous publications and mostly reflect immunohistochemical observations
