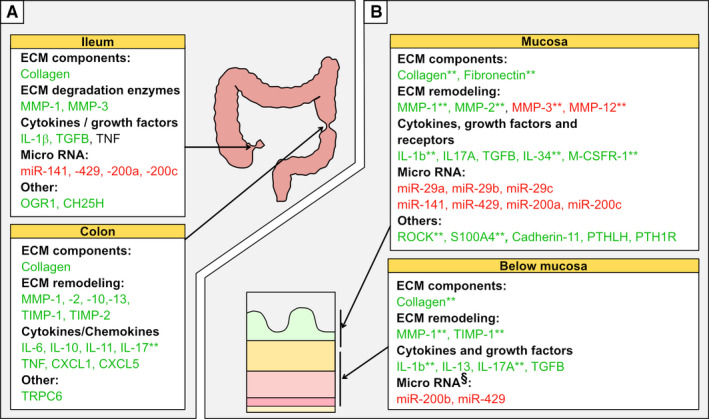
Figure 4.

Genes and proteins expressed in strictured tissue compared to normal tissue. A, Shows differences in whole tissue analyses of mRNA and/or protein in strictured ileum (upper panel) and colon (lower panel) compared to non‐strictured tissue. B, Shows differences in intestinal wall layer expression of relevant proteins, mRNAs and miRNAs in the mucosa (upper panel) or below the mucosa (lower panel) of strictured tissue compared non‐strictured tissue. Green indicates expression higher than, and red indicates expression lower than, non‐strictured tissue. Standard text indicates mRNA level; * indicates protein level; ** indicates changes detected at both the protein and mRNA levels. § indicates submucosa only. Abbreviations; miR = micro‐RNA
