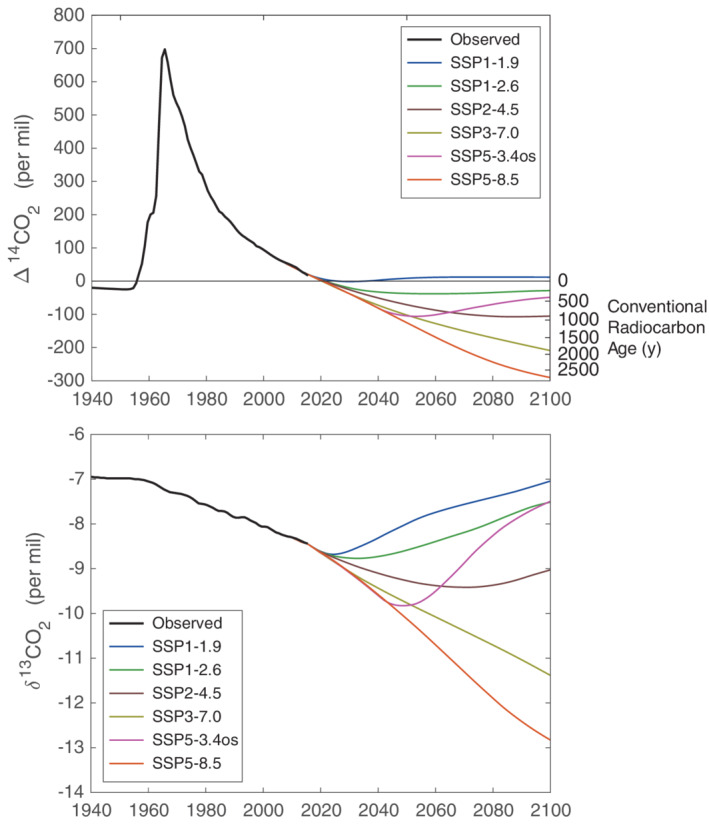
Figure 6.

Observed Δ14CO2 and δ13CO2 for 1940 to 2015 and simulated Δ14CO2 and δ13CO2 for 2015 to 2100 for the six SSP‐based CMIP6 ScenarioMIP scenarios. Colored lines show the midrange values across the 32 sets of parameters used in the simulations. The right axis in the top panel shows the conventional radiocarbon age of a carbon‐containing specimen with the same radiocarbon content, calculated by 8,033 * ln(Δ14C/1,000‰ + 1).
